Few issues have dominated the political debate in recent years like immigration. The two candidates for president, Vice President Kamala Harris and former President Donald Trump, have offered starkly different visions for immigration policy. In this analysis, we consider possible paths for net migration under these agendas and their likely macroeconomic implications.
The starting point for our analysis is the creation of a “high immigration” and a “low immigration” scenario for each presidential candidate. These scenarios reflect a combination of the historical record under the Trump administration and the Biden-Harris administration, announced and inferred immigration policies, as well as our judgment of likely developments. They are constructed from the ground up, starting by predicting inflows from specific visa categories, border and parole policy, and entries without inspection. We also predict removals, reflecting both the candidates’ visions and logistical constraints as well as other factors that affect outflows. We provide two scenarios for each candidate given the considerable uncertainty about policy actions as well as responses by migrants.
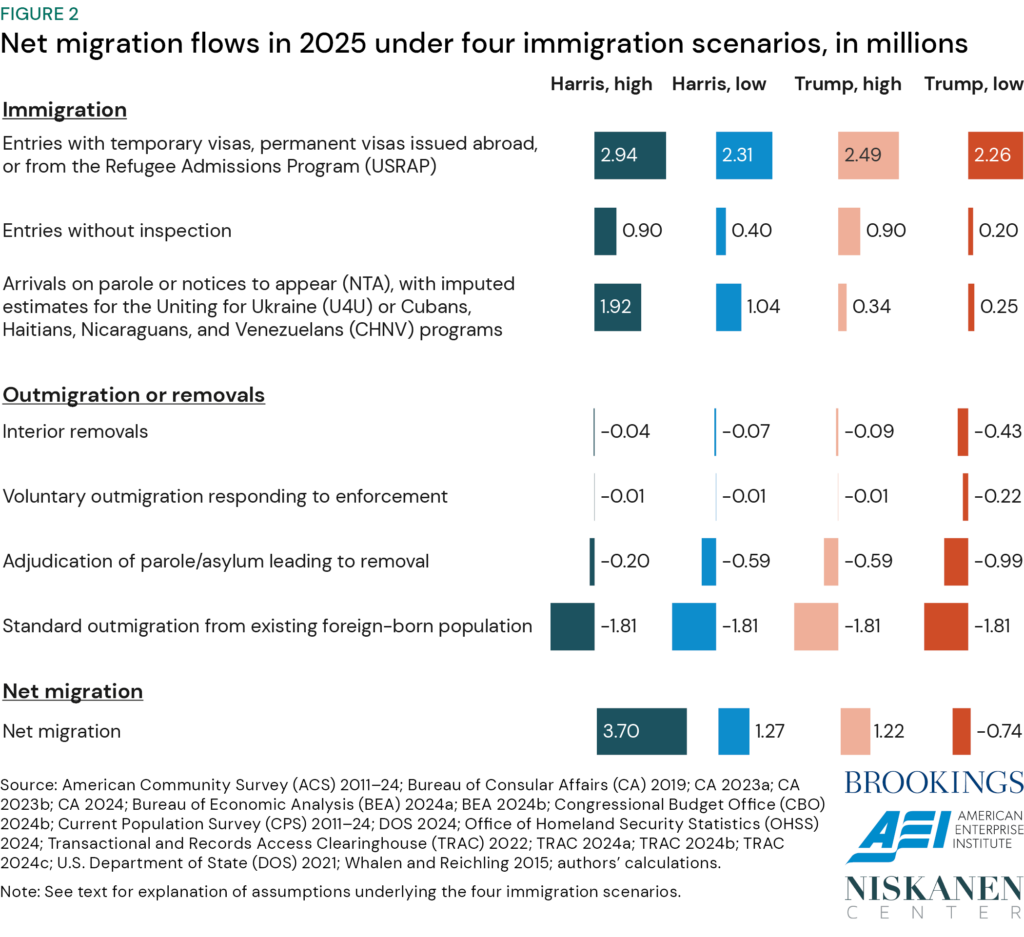
We expect net immigration to be significantly higher under a Harris administration than a second Trump administration. Our Harris, low scenario involves roughly the same net immigration flows as our Trump, high scenario. In the first two years of the Trump, low scenario, in which we anticipate the most acute departure from recent policy, we expect the United States to see net outmigration—that is, the extraordinary case of more people leaving the country than entering. For example, in our Harris, high scenario net migration is 3.7 million in 2025, whereas in the Trump, low scenario net migration is negative 740 thousand. To be sure, immigration flows could be outside the range of our four scenarios. For example, former President Trump has called for immediate mass deportations more than 10 times what we incorporated in our Trump, low scenario.
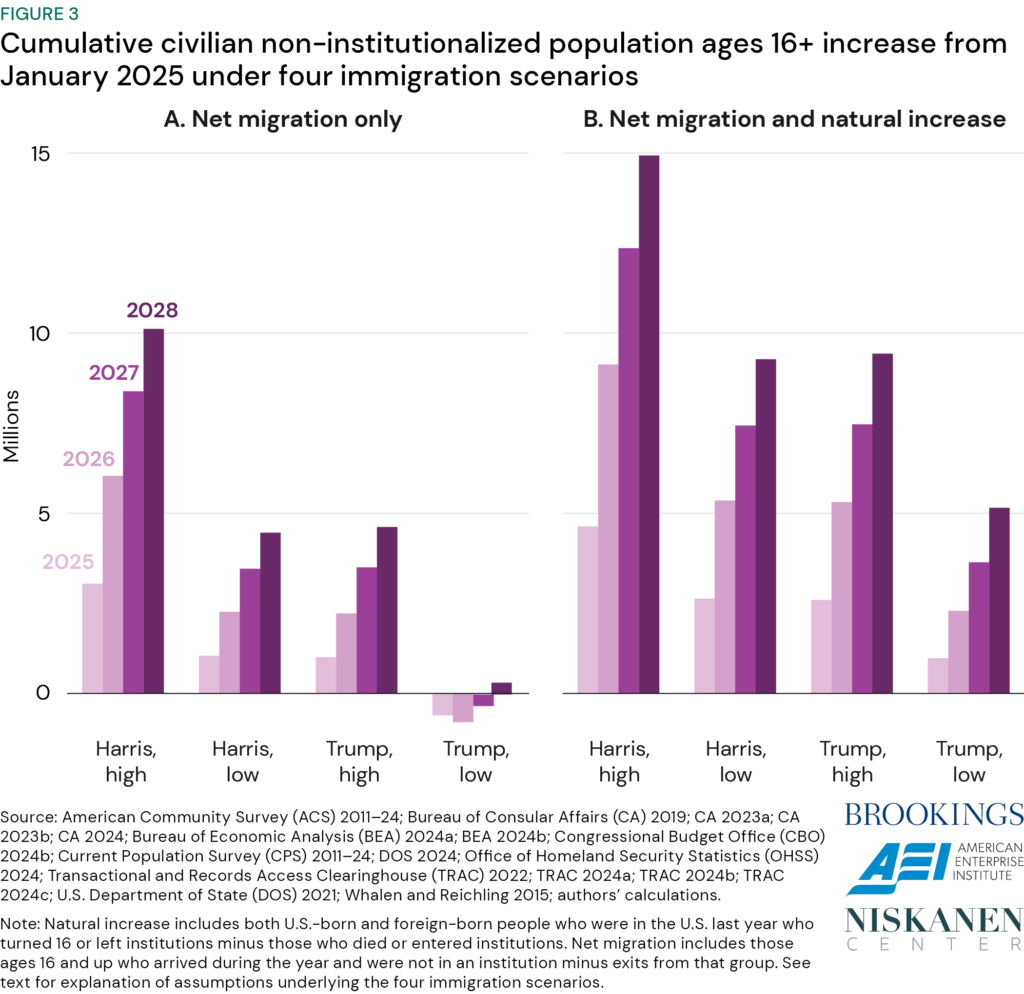
Each of these scenarios for net immigration flows has different consequences for the U.S. economy. We show how they would involve different patterns of population growth over the coming years. The cumulative growth in the total civilian non-institutionalized population over age 16 (CNIP) over four years, including both U.S.-born and foreign-born people, could be as little as 5 million people or as many as 15 million people depending on the scenario. For comparison, continuation of average CNIP growth between January 2000 and January 2024 would suggest a four-year gain of 9 million people.
We use CNIP population growth to predict labor force growth, considering the mix of skills and earnings power immigrants are likely to bring. The scenarios in which we observe a reduction in labor force growth from lower immigration are also scenarios in which we see reduced growth in earnings, consumption, and output. When greater immigration adds more to the labor force, the opposite happens.
Ultimately, we project a gap in 2025 GDP growth between the Trump, low and Harris, high scenarios of roughly half a percentage point from differences in immigration policy (meaning that GDP in 2025 would be lower in the Trump immigration scenario than in the Harris scenario by around $130 billion). Beyond 2025, the economy under the Trump, low scenario would continue to be notably smaller than the economy under the other scenarios. The consequences of a more extreme mass deportation policy would be economically disruptive in unpredictable ways and are not modeled here.
What will net immigration flows look like after 2024?
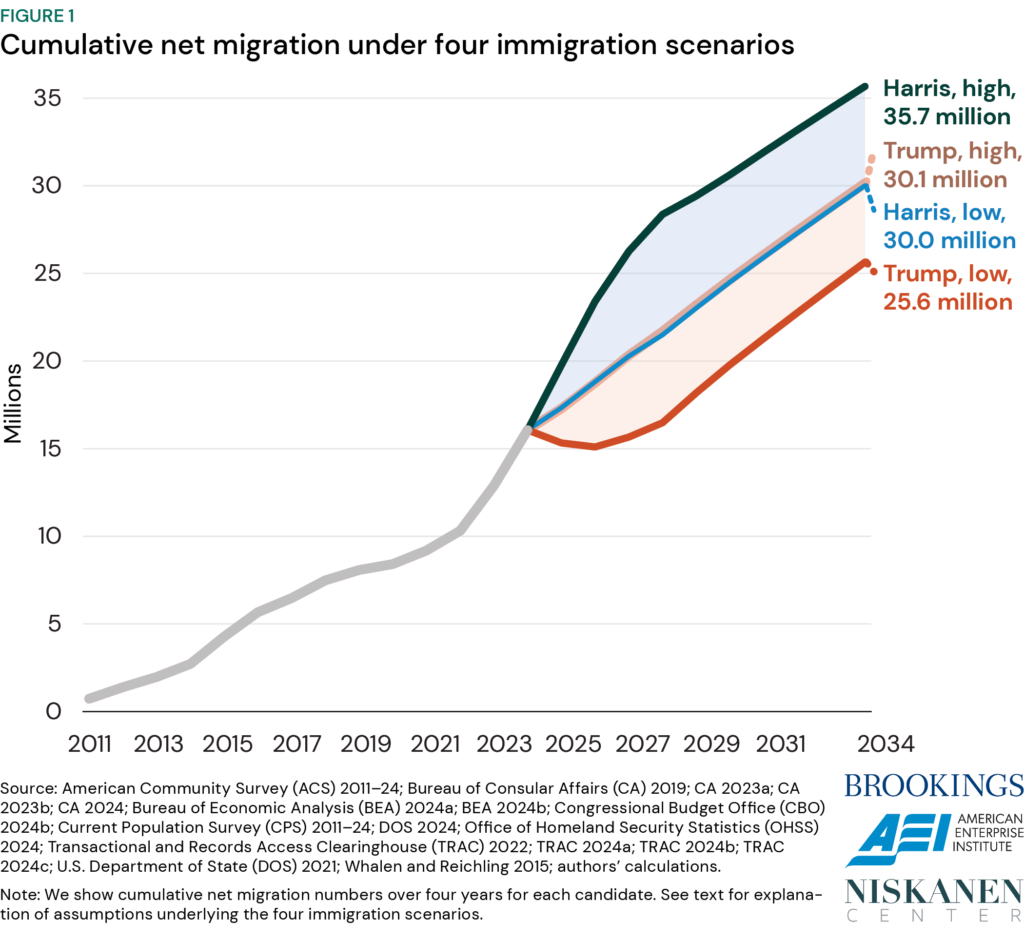
Net immigration is determined by a combination of inflows and outflows. Estimates of these flows are subject to significant uncertainty even in retrospect (see e.g., Edelberg and Watson 2024). Here we analyze the macroeconomic implications of net immigration rates during the next presidential term (2025–28) and immediately afterwards, which are subject to multiple additional layers of uncertainty. We therefore sketch out four different scenarios. For both Vice President Harris and former President Trump, we create scenarios with high and low rates of net immigration. The resulting net migration flows under each scenario are shown in figure 1.
We think of the scenarios as spanning the likely range of each candidate’s policy actions, something like the 20th percentile of resulting net flows (“low”) to the 80th percentile (“high”). Of course, U.S. immigration policy is not the only determinant of immigration flows. All four scenarios are subject to shocks from push and pull factors, like humanitarian crises abroad or fluctuations in economic performance at home. The strong U.S. labor market in the past two years was likely a driver of the relatively high rates of net immigration, and it is unlikely we would have seen as many recent Ukrainian and Venezuelan arrivals without the collapse of the Venezuelan economy or Russia’s full-scale invasion of Ukraine. It is also possible that non-immigration policies enacted by either candidate could affect these push and pull factors in ways we have not modeled here. In addition, our scenarios implicitly assume that the menu of feasible immigration policy options is constrained by the moderating influence of the courts, public opinion, Congress, and state and local authorities; we have not attempted to model more extreme scenarios.
For each scenario we estimate the number of individuals obtaining permanent residency from abroad and entering on regular nonimmigrant visas (excluding business visitors, tourists, and travelers in transit) or through a refugee resettlement program. We assume that administrations directly affect these legal migration inflows for four years, after which point they revert to long-run levels which are assumed to be the same in all scenarios starting in 2029. We next model inflows for the humanitarian parole programs for Cubans, Haitians, Nicaraguans, and Venezuelans (CHNV) and Ukrainians (U4U), individuals who enter the country without inspection, and encounters at or between ports of entry that lead to a migrant receiving a notice to appear (NTA) or other forms of parole. For these categories, we assume sharp differences in inflows in the first two years of each administration, followed by a gradual return to the same assumed long run in all scenarios by 2029.
From this total inflow we subtract outmigration flows. We assume typical exit rates among different categories of migrants such as those who entered in the prior two years with a permanent immigrant visa (4 percent), those who entered in the past two years on a regular nonimmigrant visa (20 percent), those who entered without inspection over the past two years (4 percent), and the stock of the long-term foreign-born population (2 percent). In 2025, we model the total foreign-born stock by adding the Census 2023 estimate of 47.8 million to the 3.3 million estimate for 2024 net migration generated by the Congressional Budget Office (CBO). To allocate the total stock across arrival categories, we use legal visas issued and border flows for FY 2023 as a proxy for 2023 and extrapolated data for FY 2024 to proxy for 2024. We also use CBO’s estimate of 860,000 entries without inspection in 2023 and assume it applies to 2024. The differences in exits from these categories across the four scenarios emerge only from the different stocks of immigrants which result from differential inflows by scenario.
We also model some outflows that are directly affected by policy decisions. These include removals due to interior enforcement, voluntary responses to that enforcement, and removals that result from adjudication of recent parole or notice to appear (NTA) cases. Interior enforcement estimates are based on historical patterns as described below, except that the first two years of the Trump, low scenario generates five times the interior removals as the historical average observed in Trump’s first term. Interior enforcement differences are especially pronounced in the first two years and gradually return to an assumed long-run level, which is the same across all scenarios by 2029. We generally assume that voluntary exits due to enforcement equal 15 percent of the interior removals, to reflect chilling effects and out-migration of other family members when one family member is deported. However, in the Trump, low scenario we assume the chilling effects will be much more significant. These assumptions are inherently speculative. Finally, we allow for a range of possibilities for exit rates among individuals who have arrived recently as asylum-seekers and parolees, many of whom will lose the legal right to stay in the United States during the next four years.
Figure 2 summarizes the inflows and outflows by category for 2025 for each modeled scenario and the resulting net migration for that year. Though immigration inflows gradually converge and are assumed to all reach the same levels by 2029, there are significantly different stocks of migrants in the U.S. in that year under the different scenarios. A greater number of immigrants in the U.S. in 2029 means greater numbers of emigration in later years; as a result, higher-migration scenarios have greater outflows and lower net migration rates after 2029 (figure 1).
The remainder of this section discusses the assumptions underlying our estimates for each scenario in more detail.
Harris, high
The Harris high-immigration scenario is one in which legal immigration is similar to what we have seen during the post-Title 42 Biden administration. This is the scenario with the highest cumulative net migration rate of the four scenarios we analyze.
In this scenario, for each permanent and temporary visa category and the refugee program, we take the average number of arrivals from 2023 and 2024. We assume these flows of 2.9 million persist through the four years of the administration, after which they return to assumed long run levels. For 2025 and 2026, we assume the 2023–24 average for CHNV arrivals and NTA/parole arrivals, and 25,000 U4U arrivals. This scenario also assumes lower levels of border enforcement for the first two years and includes 900,000 entries without inspection. These categories gradually return to an assumed long-run level by 2029.
From this total number of arrivals, we subtract outflows. We assume interior removals in 2025 and 2026 equal their 2023 number of around 44,000, then gradually return to an assumed long-run level of 70,000 by 2029. Voluntary exits in response to enforcement are equal to 15 percent the number of interior removals. In addition, we assume only 5 percent of those who arrived with NTA/parole in the prior two years are removed. This would occur, for example, if humanitarian parole protections are extended indefinitely so that only 10 percent of recent arrivals reach a final asylum determination each year. Historically, about half of asylum claims are denied. Finally, we assume the same exit rates for other recent arrivals and long-term residents described above for all scenarios.
Net migration in the Harris, high scenario is 3.7 million in 2025 and cumulates to 12.3 million from 2025–2028.
Harris, low
The Harris low-immigration scenario is one in which legal immigration is comparable to the low end of what we have seen during the post-Title 42 Biden administration. It is also one in which enforcement at the border and in the interior are somewhat more stringent than they have been in the final months of the administration.
To estimate arrivals on immigrant visas and regular non-immigrant visas in this scenario, for each visa category, and the refugee resettlement program, we take the lower number of arrivals from 2023 or 2024. We assume these lower numbers, around 2.3 million, are in place for four years, after which the number of arrivals reverts to an assumed long-run of around 2.8 million.
In 2025 and 2026, we assume 25,000 for U4U arrivals and the lower of 2023 and 2024 numbers for CHNV arrivals, NTA inflows, and parole inflows at ports of entry. For inflows between ports of entry, we assume a 50 percent reduction relative to the lower of 2023 or 2024, under the assumption that the Harris administration could continue to enact measures similar to Biden’s June 2024 executive order. These categories sum to 1.04 million in 2025 and 2026, then gradually converge to an assumed long run of 300,000 by 2029. In this scenario we assume the Harris administration adds significant resources to border enforcement, yielding a reduction to 400,000 entries without inspection in each year. Though entries without inspection were even lower than that figure in the Obama and the Trump administrations, we anticipate only a partial return to the lower levels.
For the Harris, low scenario in 2025 and 2026, we assume interior removals that are 50 percent above the 2023 number for 2025 and 2026, assuming the administration would be more aggressive than the Biden administration and remove around 66,000 people from the interior. These numbers are assumed to start converging to their assumed long run of 70,000 in 2027. We assume voluntary removals in response to enforcement equal to 15 percent of the number of interior removals. In addition, for each year we assume 15 percent of those who arrived with NTA/parole in the prior two years are removed or otherwise exit. This is consistent with a scenario in which 30 percent of those arriving in this category in the prior two years face a final asylum adjudication or termination of parole, and that half of those are denied relief, consistent with historical trends. Other exit rates are the same as described above.
Overall, the Harris, low scenario yields net migration of about 1.3 million in 2025 and 1.5 million in 2026, peaks in 2029 at 1.5 million, then eventually falls back to around 1.3 million. Cumulative net migration from 2025 through 2028 is 5.4 million.
Trump, high
The high-immigration scenario under a second Trump administration is one in which legal immigration policy reflects the pre-pandemic Trump administration with the consequences of enforcement reflecting the record of the Trump administration while recognizing the higher levels of border activity seen in the past few years.
In this scenario, for each visa category and the refugee resettlement program we take the average number of arrivals from 2017 through 2019. We assume these levels stay in place throughout the four years. We assume the CHNV and U4U programs are terminated and take the average number of encounters from 2017 through 2019 that led to NTA or parole; these levels are in place for two years and then gradually return to the assumed long run. We assume interior removals equal to their 2017–2019 average for the first two years, then a gradual return to the assumed long-run level. We assume voluntary removals in response to enforcement equal to 15 percent the number of interior removals. In addition, we assume 15 percent of those who arrived with NTA/parole in the prior two years are removed. All other assumptions are unchanged.
The Trump, high scenario has net migration of around 1.2 million in 2025. Cumulative net migration is around 5.6 million over four years.
Trump, low
The Trump low-immigration scenario is one in which legal immigration is slightly below where it was during the pre-pandemic Trump administration, while enforcement and deportation efforts reach levels not seen in recent decades. Trump has sometimes alluded to an Eisenhower-era mass deportation effort, offensively named “Operation Wetback,” which may have been responsible for removing over a million people from the country in 1954. The Trump, low scenario we model involves fewer annual removals than that episode and many fewer than some of stated aims on the campaign trail, but nevertheless would represent a dramatic shift from the current enforcement environment. This is the scenario with the lowest cumulative net migration rate of the four scenarios we analyze.
In this scenario, for each visa category we take the average number of arrivals from 2017 through 2019 and reduce it by 5 percent. We further reduce student visas by 90,000 according to Project 2025 proposals (Esterline 2024) and reduce refugee resettlement to 15,000 per year. We assume these inflows would hold for the four years of an administration, after which time policy would revert to the long-run level in 2029.
For 2025 and 2026, we assume the CHNV and U4U programs are terminated. We assess that only 200,000 people will enter without inspection as border enforcement is significantly ramped up. We take the average number of border encounters at or between ports of entry from 2017 through 2019 that led to NTA or parole and reduce it by 25 percent, under the assumption of a less hospitable border environment than the first Trump term. For all of these categories, we assume that after the first two years inflows will gradually return to an assumed long-run level by 2029.
Due to logistical, financial, legal, and political constraints, the Trump, low scenario assumes enforcement would be less pronounced than the full scope of mass deportation of all undocumented immigrants which Trump has sometimes articulated. Nevertheless, the Trump, low scenario would still reflect an extreme level of immigration enforcement relative to living memory. We assume interior removals will equal five times their 2017–2019 average for 2025 and 2026, gradually returning to their long-term level by 2029. And we assume voluntary outmigration in response to enforcement will rise to 50 percent the number of interior removals each year due to chilling effects from extreme enforcement environment. In addition, we assume 25 percent of those who arrived with NTA/parole in the prior two years are removed, as would happen if the parole programs were terminated and asylum applications were denied at an elevated rate. All other assumptions are unchanged.
Unlike the other scenarios, the Trump, low scenario yields net negative migration. Net migration is around -740,000 in 2025 and -230,000 in 2026, after which time it becomes positive. Cumulative net migration over the four years is around 410,000.
Macroeconomic consequences of the candidates’ immigration policies
With declining fertility and an aging population, net immigration has constituted the vast majority of population growth since the pandemic (CBO 2024c). Beginning in 2025, net immigration is different for each scenario we consider which leads to different growth rates for the population. In order to estimate what those immigration paths imply for the macroeconomy, we estimate how many of the arriving immigrants would be part of the civilian non-institutionalized population over the age of 16, because that comprises the people who could potentially add to the U.S. labor force. We estimate the fraction of immigrants that would be part of that population using the American Community Survey (2015–2022) and the Current Population Survey (2023–2024). Figure 3 shows our estimates of what the four net migration scenarios would imply for the cumulative increase in the civilian non-institutionalized population over the age of 16 from 2025 through 2028. Panel A shows cumulative net migration in this population, and Panel B models the total cumulative population growth, including the natural increase. In the Trump, low scenario, the cumulative increase in the civilian non-institutionalized population over age 16 is 5 million people through 2028 versus 15 million in the Harris, high scenario.
Similarly, we use survey evidence from recent years to estimate what fraction of the adult immigrant population would participate in the labor force conditional on how long those immigrants have been in the U.S., what fraction has a college degree, the unemployment rates for recent immigrants with and without a college degree, and average earnings for those groups. This produces, for each scenario, a path for the number of additional workers, by skill level and associated level of earnings, in the labor force for each future year. Those earnings underlie the estimated output generated by U.S. immigrants that are reflected in the first rows of tables 1 and 2 below.
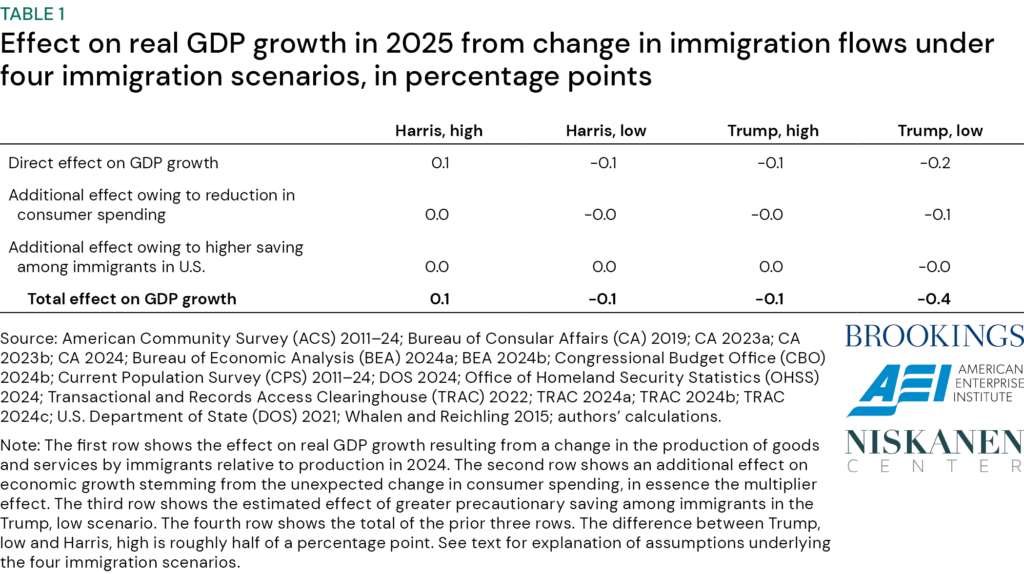
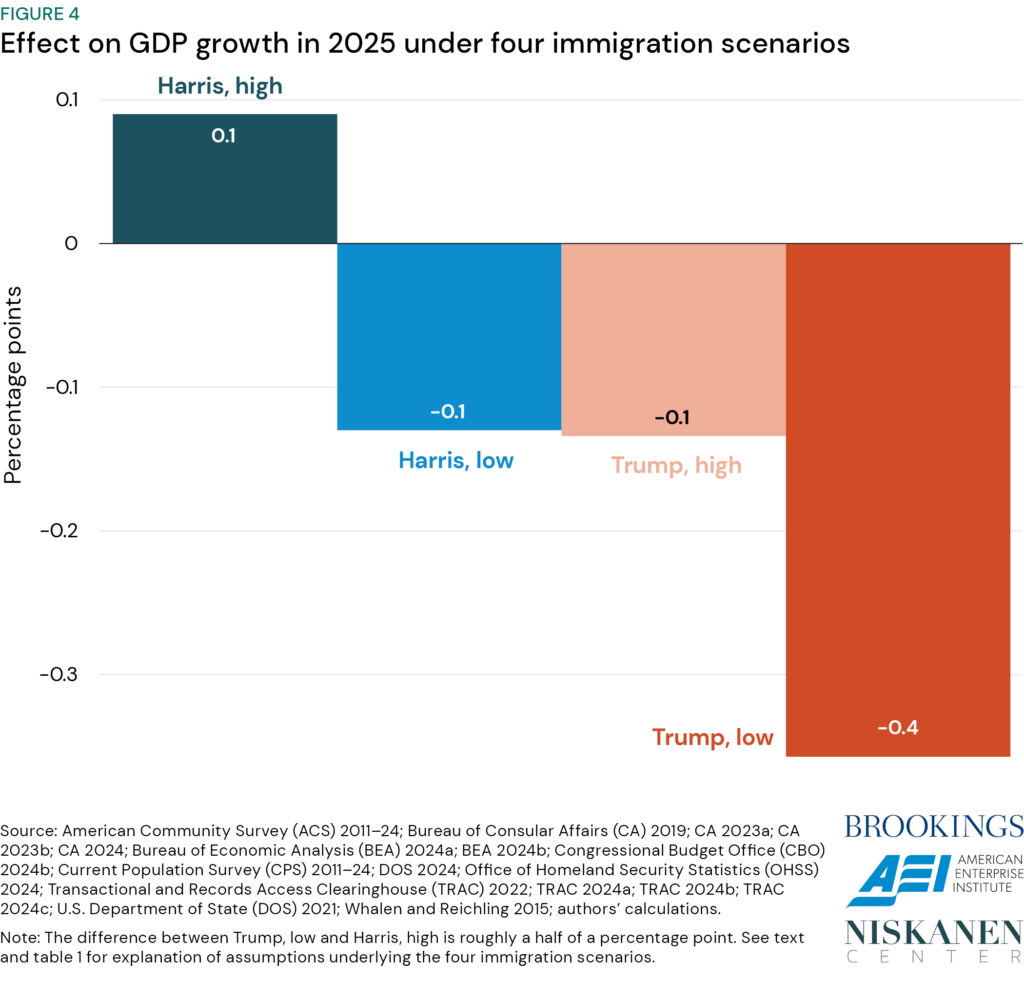
Different rates of labor force growth and different paths of labor market earnings will translate into different levels of output. For each immigration scenario, table 1 shows the effect on real GDP growth in 2025 by its components and figure 4 visualizes the total effect on GDP growth.
The first row of table 1 shows what the resulting direct effect on real GDP growth in 2025 would be from the different labor market outcomes in the four scenarios. The immigration path under the Trump, high scenario, with net immigration of 1.2 million next year, would reduce GDP growth by 0.1 percentage point in 2025 compared to the boost from immigration in 2024. The numbers in the table’s top row for the other scenarios should be interpreted in the same way. All scenarios other than the highest (Harris, high) involve reductions in net migration compared to 2024 and therefore a negative effect on GDP growth.
The second row of table 1 shows an additional effect on economic growth stemming from the unexpected change in consumer spending, which would be affected by the change in net immigration in 2025. Generally, these aggregate economic effects are estimated to be small. Unexpected changes in consumer spending are predicted to affect the economy because of the responses of businesses facing lower demand. In essence, if businesses have made hiring and production decisions for 2025 assuming that the growth in near-term demand will be similar to that in 2024, they will be surprised and will respond when spending growth turns out to be different. If net immigration flows were zero in 2025 and consumer spending grows more slowly as a result, some businesses will lay workers off or otherwise pull back on production. (Those laid-off workers might be U.S.-born or immigrants remaining in the U.S.). Normally, one would expect the Federal Reserve to make monetary policy more accommodative in the face of an unexpected reduction in aggregate demand. However, in this case both actual output and the economy’s ability to produce goods and services would be dampened, so monetary policy may not fully respond in an attempt to offset those effects. The result would be that investment and hiring would fall more than otherwise after a drop in consumer demand. We therefore use the average of fiscal multipliers that are relevant when monetary policy is mostly unresponsive to changes in demand (Whalen and Reichling 2015).
In order to estimate the initial effect on consumer spending, we assume that the rate of saving among recent immigrants in 2025 would be equal to 5.2 percent, the nationwide average rate in year-to-date 2024. On one hand, the saving rate among recent immigrants could be higher than that of the general population to the degree they send that income abroad in the form of remittances rather than spending it on U.S. goods and services. On the other hand, their saving rate could be lower to the degree that recent immigrants have significant spending needs and few financial resources to draw on. In the end, we use the national saving rate and note the estimated effects on consumer spending are not particularly sensitive to moderate differences in the saving rate assumption.
The third row of table 1 includes an effect we think is only notable in the Trump, low scenario: an increase in precautionary saving by immigrants faced with an extreme enforcement environment. In this scenario, we assess that saving rates would rise among recent immigrants who remain in the U.S. More precisely, we estimate that their rate of saving would be 8 percent, just above the national average of the saving rate in 2019, instead of 5.2 percent. This effect further reduces real GDP growth in 2025 by a small amount in the Trump, low scenario. Of course, if the saving rate rose more or more people than we estimate raised increased their saving rates, the effect on spending and output would be more negative.
Several potentially important effects are not included in the estimates summarized in table 1. For example, the estimates do not include any change in corporate profits or other kinds of capital income that might immediately result from the change in labor supply in 2025. (These effects are reflected in the longer-term estimates shown in table 2.) In addition, the estimates do not include any broad change in business or consumer sentiment that might lead to additional changes in investment or household spending.
Under each of the four scenarios, cumulative net migration would be positive by 2034. As a result, the size of the labor force would be larger than in a comparison benchmark where net migration is zero in every year between 2025 and 2034. Table 2 shows the estimated effect on the level of GDP in 2034 in each of the four scenarios relative to a benchmark under which there is no additional net migration.
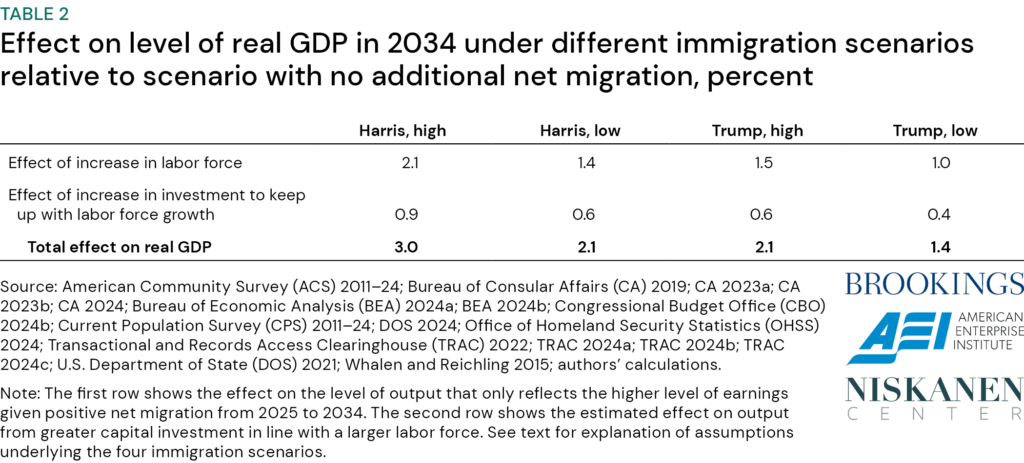
The second row shows the estimated effect on output from greater capital investment. Because immigrants who come to the U.S. between 2025 and 2034 would require equipment and infrastructure to effectively do their jobs, we expect that the capital stock would be proportionally larger in scenarios with more immigration. Investors would receive greater capital income as a result. The third row combines the effects of greater labor supply and a larger capital stock.
The estimates do not incorporate any positive effect on productivity directly owing to immigration. In particular, the CBO estimates that “innovations generated by immigrants working in STEM occupations increase productivity” (CBO 2024a). Based on CBO’s estimate, incorporating such an effect might increase the level of GDP in 2034 under Harris, high by roughly one-fourth percent relative to GDP under Trump, low.
The analysis highlights two important points. First, the two major-party candidates for presidents this year offer far-reaching immigration proposals that would have different consequences for population and labor force growth. In the near term, a sharp reduction in net migration would dampen real GDP growth because it would mean a smaller labor force and thus a smaller number of people producing goods and services. Specifically, if net migration fell from significantly positive in 2024 to negative 740,000 in 2025 as under the Trump, low scenario, the reduction in production of output by immigrants would subtract 0.2 percentage points off GDP growth next year (as shown in the first row of table 1). Consistent with a smaller labor force growth, we expect that monthly employment growth would be considerably lower in 2025 than in 2024: We estimate that the reversal from positive net migration to negative net migration would reduce employment growth by roughly 100,000 a month.
In addition, the reduction in consumer spending resulting from negative migration in that scenario would lead businesses to cut back on investment and hiring, which would further reduce GDP growth by 0.1 percentage point. Finally, an effort to implement an aggressive deportation policy, even falling short of the mass deportation implied by rhetoric, would likely reduce spending among immigrants who remain in the U.S., which we estimate would further reduce GDP growth. If net migration in 2025 were even more negative than under the Trump, low scenario, the economic effects would be more negative.
The immigration scenarios also have different implications for the U.S. economy over the longer-term. Relative to a path with no net immigration between 2025 and 2034, the four scenarios raise the level of real GDP in 2034 by between 1.4 percent and 3.0 percent. Those differences flow directly from the fact that the size of the labor force and in 2034 would be considerably smaller in the Trump, low scenario than in the Harris, high scenario.
Even so, our assumptions for a Trump, low scenario imply 3.2 million total removals over four years, falling well short of the deportation aspirations of Trump’s campaign rhetoric. A higher deportation rate would have more adverse macroeconomic consequences, and would disrupt labor markets, supply chains, and civil society in unpredictable ways beyond what we have modeled here. While we deem full implementation of the campaign rhetoric unrealistic, analysis conducted by McKibbin et al. (2024) finds that the aggregate economic impacts of removing 7.5 million workers would be even more profound both in the short term and in the long term.
Conclusion
Given the long-term trends of fertility rates and population aging in the U.S., immigration is projected to be an increasingly important factor underlying labor force growth (Vespa, Medina, and Armstrong 2018). Policies that constrain immigration would shrink the size of the labor force. In addition, immigration has been shown to raise productivity, generating further long-run growth that has not been incorporated into our estimates.
The consequences for the aggregate economy are clear, but the fiscal effects of immigration are also worth noting. Immigration improves the federal budget because immigrants pay more in federal income and payroll taxes than they use in federal benefits. In a 2017 consensus report, the National Academies of Sciences calculated that the marginal benefit to the federal budget of each additional new immigrant and their descendants over 75 years is $326,000 in present value in 2023 dollars (or $259,000 in the study as reported in 2012 dollars). However, states and localities often face fiscal challenges in the short run when absorbing new arrivals; see Edelberg and Watson (2022) for a proposal to address that imbalance.
Regardless of how immigration flows play out over the next four years, there is widespread agreement that the immigration system is in need of repair. The lack of congressional direction contributes to the wide disparities in policy based on the choices of the executive branch. The time is long overdue for Congress to grapple with immigration reform.
Acknowledgments
The authors are grateful to Lauren Bauer, Mikkel Davies, Este Griffith, and Alex Nowrasteh for their insightful comments. Olivia Howard and Eileen Powell provided excellent research assistance. Lastly, the authors would like to thank Jeanine Rees for the graphic design in this document.
References
Bureau of Consular Affairs (CA). 2019. “Report of the Visa Office 2019” (Table XV). U.S. Department of State, Washington, DC.
Bureau of Consular Affairs (CA). 2023a. “Report of the Visa Office 2023” (Table III). U.S. Department of State, Washington, DC.
Bureau of Consular Affairs (CA). 2023b. “Report of the Visa Office 2023” (Table XV). U.S. Department of State, Washington, DC.
Bureau of Consular Affairs (CA). 2024. “Monthly Nonimmigrant Visa Issuance Statistics.” U.S. Department of State, Washington, DC.
Congressional Budget Office (CBO). 2024a. “Effect of the Immigration Surge on the Federal Budget and the Economy.” Congressional Budget Office, Washington, DC.
Congressional Budget Office (CBO). 2024b. “Historical Data and Economic Projections.” Congressional Budget Office, Washington, DC.
Congressional Budget Office (CBO). 2024c. “The Demographic Outlook: 2024 to 2054.” Congressional Budget Office, Washington, DC.
Edelberg, Wendy, and Tara Watson. 2022. “A More Equitable Distribution of the Positive Fiscal Benefits of Immigration.” The Hamilton Project, Brookings Institution, Washington, DC.
Edelberg, Wendy, and Tara Watson. 2024. “New Immigration Estimates Help Make Sense of the Pace of Employment.” The Hamilton Project, Brookings Institution, Washington, DC.
Esterline, Cecilia. 2024. “The fifteen categories of immigration cut off by Project 2025.” Niskanen Center, Washington, DC.
McKibbin, Warwick, Megan Hogan, and Marcus Noland. 2024. “The International Economic Implications of a Second Trump Presidency.” Working Paper 24-20, Peterson Institute for International Economics, Washington, DC.
National Academies of Sciences, Engineering, and Medicine (NASEM). 2017. The Economic and Fiscal Consequences of Immigration. Washington, DC.
Office of Homeland Security Statistics (OHSS). 2024. “Immigration Enforcement and Legal Processes Monthly Tables,” Confirmed CHNV Beneficiaries by Process: Fiscal Years 2023 to 2024 YTD. Office of Homeland Security Statistics, Washington, DC.
Transactional Records Access Clearinghouse (TRAC). 2022. “Border Patrol Arrests. CBP Data through July 2022.” Produced and distributed by Transactional Records Access Clearinghouse, Syracuse, NY.
Transactional Records Access Clearinghouse (TRAC). 2024a. “Immigration and Customs Enforcement Removals.” Produced and distributed by Transactional Records Access Clearinghouse, Syracuse, NY.
Transactional Records Access Clearinghouse (TRAC). 2024b. “Stopping ‘Inadmissibles’ at U.S. Ports of Entry.” Produced and distributed by Transactional Records Access Clearinghouse, Syracuse, NY.
Transactional Records Access Clearinghouse (TRAC). 2024c. “Who is Being Given Humanitarian Parole to Temporarily Enter the Country: Latest Data.” Produced and distributed by Transactional Records Access Clearinghouse, Syracuse, NY.
U.S. Bureau of Economic Analysis (BEA). 2024a. “Non-cyclical Rate of Unemployment.” Retrieved from Federal Reserve Bank of St. Louis, U.S. Department of Commerce, Suitland, MD.
U.S. Bureau of Economic Analysis (BEA). 2024b. “Personal Saving Rate.” Retrieved from Federal Reserve Bank of St. Louis, U.S. Department of Commerce, Suitland, MD.
U.S. Bureau of Labor Statistics (BLS). 2011-24. “American Community Survey.” U.S. Department of Labor, Washington, DC.
U.S. Bureau of Labor Statistics (BLS). 2011-24. “Current Population Survey.” U.S. Department of Labor, Washington, DC.
U.S. Department of State (DOS). 2021. “Report to Congress on Proposed Refugee Admissions for Fiscal Year 2021,” Refugee Admissions and Asylum Grants since 1980. U.S. Department of State, Washington, D.C.
U.S. Department of State (DOS). 2024. “Report to Congress on Proposed Refugee Admissions for Fiscal Year 2024” (Table I). U.S. Department of State, Washington, D.C.
Vespa, Jonathan, Lauren Medina, and David M. Armstrong. 2018. “Demographic Turning Points for the United States: Population Projections for 2020 to 2060.” U.S. Census Bureau, Washington, DC.
Whalen, Charles J., and Felix Reichling. 2015. “The Fiscal Multiplier and Economic Policy Analysis in the United States.” Working Paper 2015-02, Congressional Budget Office, Washington, D.C.