Good government has been a focus of political philosophers for centuries, but times change. Today’s thinkers, unlike Plato or Ibn Khaldun, can draw on abundant data to test and refine their theories on the merits and drawbacks of various regimes. And data is not just for theorists. Good data can provide would-be reformers with practical insights in their day-to-day efforts to make government more effective and strengthen democracy.
But where to start? A profusion of indexes compete to measure quality of government, state capacity, state fragility, liberal democracy, electoral democracy, varieties of democracy, and more. Which one is the best? Or are they all so alike that the choice doesn’t matter?
This paper offers a map through the thicket of governance data. The first section deals with some key terms and concepts. The second develops a pair of benchmark indexes that are closely aligned with the theoretical categories of state capacity and liberal democracy. The third examines the similarities and differences among a sample of widely used quality-of-government measures, and their implications for the relationship between liberal democracy and state capacity. The fourth section looks at what we can learn by looking beyond statistical regularities to specific country outliers. Finally, the conclusion takes up the question of how best to integrate theoretical, practical, and quantitative approaches to the study of good government.
Terms and concepts
Before going further, we need to nail down some key terms and concepts, beginning with state capacity. I will follow the lead of the many writers who define state capacity in terms of a specific list of government competencies. The Niskanen Center State Capacity Project identifies those as the ability of government to effectively raise taxes, maintain order, and provide public goods. Jonathan Hanson and Rachel Sigman, creators of one of the indexes used below, call these extractive, coercive, and administrative capacities. I prefer the terms fiscal capacity and security capacity for the first two, along with administrative capacity for the third. I take all of these three-part definitions as essentially equivalent.
It is worth noting, however, that some other writers use the term “state capacity” more loosely. For example, in their book The Narrow Corridor, Daron Acemoglu and James A. Robinson write simply that “the capacity of a state is its ability to achieve its objectives (p. 12).” Others instead use state capacity more narrowly to mean the quality of the state’s executive and bureaucratic functions, that is, its administrative capacity alone.
Similarly, we can define liberal democracy as a set of institutions or practices. I find the list of “liberal rights practices” identified by Kevin Vallier to be especially useful. Vallier’s list includes democratic constitutionalism, markets and private property rights, freedom of association, electoral democracy, and social protection policies. In the next section I introduce a measure of liberal democracy based on a variation of that list.
In contrast to the formal definitions of the first two terms, I will use the term quality of government (QoG) more loosely. The Quality of Government Institute at the University of Gothenberg defines it as the presence of “trustworthy, reliable, impartial, uncorrupted and competent government institutions.” I am inclined to stretch that list by adding “just” and “conducive to human flourishing.” In line with that broad definition, I treat state capacity and liberal democracy as specific aspects of generalized quality of government and refer to all the various indexes used in what follows as QoG indexes.
One further note: However they are defined, there is a tendency to see state capacity as a positive construct while liberal democracy takes on a more normative coloration. Writers that follow this distinction understand a high rating for state capacity to mean simply that a government is able to achieve its chosen objectives, without judging whether the ends are good or bad. A government might, for example, receive a high state capacity score by successfully suppressing all but one preferred religion or efficiently carrying out a program of ethnic cleansing that outsiders might regard with horror. In contrast, the defining aims and institutions of liberal democracy, such as free and fair elections, limited government, and freedom of speech, are often seen not just as tools of good government, but as ends in themselves.
It will become apparent as we go on, however, that aspects of state capacity and liberal democracy can bleed into one another in a way that makes it hard to maintain the positive-normative distinction as more than a tendency. For example, a commitment to liberalism may limit the range of permissible tools that states can use to pursue their ends as well as the ends themselves — there may be such a thing as too much state capacity. There is also room for disagreement as to whether certain aspects of governance, such as government integrity (or its opposite, corruption) should be counted as an aspect of state capacity that affects the ability of a government to achieve its ends or a liberal democratic norm. In the end, whether liberal rights practices bolster or weaken state capacity is a question to be explored through historical, institutional, or (as in what follows) quantitative analysis.
Benchmarks
There is no shortage of indexes that measure one or another aspect of quality of government. This section introduces a revised version of two indexes that I have developed in previous work. One is designed to fit as closely as possible with the theoretical concept of state capacity and the other with the concept of liberal democracy, as those are defined in the previous section. Accordingly, the pair can serve as benchmarks for comparison with more widely used measures, some of which cover only one or the other of the two key concepts, or combine elements from each to form a blended index of quality of government.
To maintain methodological consistency, I have drawn all of the underlying data for the benchmark indexes entirely from the Legatum Prosperity Index, 2023 edition. The full Legatum dataset and a detailed report on methodology is available for download from the organization’s website. Data for the benchmark indexes is organized hierarchically. Each index consists of a number of components, each of which has a number of elements, which are, in turn, formed from a number of individual indicators.
The benchmark state capacity index (StatCap). The benchmark state capacity index consists of three components:
- Administrative capacity corresponds to the Legatum element government effectiveness, which comprises indicators of perceived government quality and credibility, ability to set and maintain priorities, efficiency of spending and asset utilization, ability to implement chosen policies, ability to learn from mistakes, and coordination across areas of policy.
- Security capacity is the unweighted average of the Legatum elements for war and civil conflict, violent crime, and property crime. All of these are coded so that high scores mean less conflict and crime.
- Fiscal capacity is the unweighted average of the Legatum indicators for country credit rating and country risk premium. Country credit rating is an average of the credit ratings from S&P, Moody’s, Fitch, and DBRS. Each of these ratings, in turn, reflects a wide variety of underlying economic and financial indicators such as government debt, GDP growth, balance of payments, past payment records and defaults, and so on. Country risk premiums are based on data provided by Aswath Damodaran of the Stern School of Business at NYU.
The benchmark liberal democracy index (LibDem). The benchmark liberal democracy index consists of four components:
- Limited government is the average of the Legatum elements for executive constraints, government integrity, and rule of law. These are closely related to what Vallier calls democratic constitutionalism.
- Quality of market institutions is the average of the Legatum elements for regulatory quality, property rights, investor protections, and contract enforcement.
- Personal freedom is the average of the Legatum elements agency, freedom of speech, freedom of assembly, absence of legal discrimination, and agency, which Legatum defines as “freedom to act independently and make one’s own free choices.”
- Procedural democracy corresponds to the Legatum element political accountability. It covers the mechanics of democracy, such as parties and the right to vote; the degree of public agreement on democracy as a goal; and the availability of effective complaint mechanisms outside the electoral process.
The primary consideration for selecting the elements and indicators for each of the components was their degree of fit with the theoretical concepts of state capacity and liberal democracy. After initial selection, the indicators and elements for each component were further screened according to their statistical properties. Interested readers can find complete data for the benchmark indexes in Online Supplement A. The FAQ tab of that supplement includes further information on the selection and screening processes.
Additional quality of government measures
This section introduces six additional quality of government indexes that are well established in the quality of government literature. Two of the six focus primarily on state capacity, two on liberal democracy, and two have elements that overlap both concepts. I have selected them to represent a variety of approaches. The failure to include other indexes in no way reflects any judgment on my part that they are inferior.
The first pair of indexes are based on data from the World Bank’s Worldwide Governance Indicators. The WGI does not explicitly sort its indicators into liberal democracy and state capacity categories, but it is not hard to do so. For a measure of liberal democracy (WGI-L), I use the average of WGI scores for “rule of law,” “control of corruption,” “regulatory quality,” and “voice and accountability.” For a measure of state capacity (WGI-S), I use the average of the WGI scores for “government effectiveness” and “political stability and absence of violence and terrorism.”
Next comes the index of state capacity devised by Hanson and Sigman (HSI). As noted above, it provides measures for extractive, coercive, and administrative capacities and aggregates them into an overall score. Its authors adhere explicitly to the notion that an index of state capacity should be positive in nature. As they put it, their index “eschews normative beliefs about what constitutes legitimate exercise of state power.”
The fourth of the established indexes is the Liberal Democracy Index from the Varieties of Democracy Institute. That organization publishes a large database that includes several composite indicators covering various aspects of quality of government. The one used here, which I abbreviate as VDem-LDI, can be found in Table 3 of their 2023 Democracy Report. Unlike the benchmark LibDem index, VDem-LDI includes an egalitarian component that can be construed as a measure of Vallier’s social protection practices.
The final two indexes include elements that overlap the theoretical constructs of liberal democracy and state capacity. One is the Democracy Index (EIU-Dem) from the Economist Intelligence Unit. The other is the Fragile States Index (FSI) sponsored by The Fund for Peace. The FSI index, as published, assigns highest scores to the most fragile states, which tend to be both low in capacity and illiberal. (The relatively few illiberal but high-capacity countries and those that are weak but liberal have FSI scores somewhere in the middle of the pack.) For purposes of this study, I invert the scale so that the most fragile states have low scores.
Table 1 provides an overall comparison of the two benchmarks and the six established indexes. Coverage differs from one index to another. The results reported below are based on 153 countries that are included in all of them. Data for all eight indexes, standardized with means equal to zero and standard deviations equal to 1.0, can be found in Online Supplement B. Details on sources and methodology, along with underlying data, are available from the original sources.

Are they all alike?
The eight indexes in Table 1 fall into three distinct groups according to their fit with the qualitative categories of liberal democracy and state capacity. This section shifts attention from the qualitative to a key quantitative question: Despite their theoretical differences, are the indexes so much alike statistically that it matters little which of them is used in any given research project, or are there critical differences beneath their superficial similarities?
Andrea Vaccaro raises exactly that question in a recent paper titled “Measures of state capacity: so similar, yet so different.” This section follows Vaccaro’s lead by decomposing the question of similarity into two parts, convergence and interchangeability. Convergence is measured by general statistical properties. Interchangeability is a matter of whether competing measures lead to the same conclusion when used to test one or another specific hypothesis.
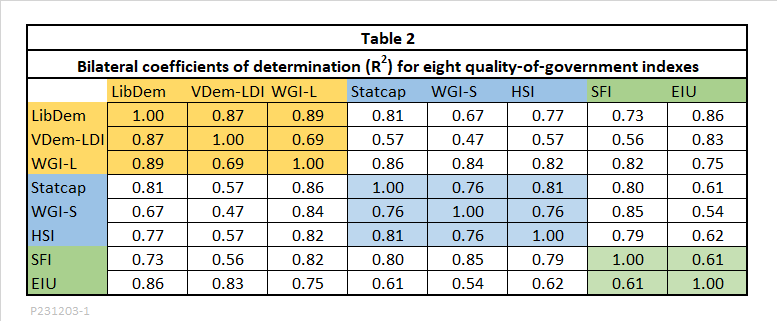
Convergence. The most basic measures of convergence among the QoG indexes are simple bilateral correlations. Table 2 shows the degree of similarity between each pair of indexes as measured by the coefficient of determination. That statistic, abbreviated as R2, is the square of the simple correlation coefficient R. R2 shows the proportion of the variation in the values of one member of the pair that can be explained by the other member. For example, the second cell in the top row of the table shows that 87 percent of the variation in the index LibDem can be explained by the index VDem-LDI. That suggests that the two indexes, while not identical, convey much of the same information. All of the R2 values in the table are statistically significant. The degree of convergence is particularly strong within the three liberal democracy indexes and the three state capacity indexes, but there is substantial similarity even between pairs of indexes from different categories.
Another statistic, called Cronbach’s alpha, provides an alternative measure of convergence. Cronbach’s alpha is useful in comparing several different ways of measuring a given concept, for example, different items of a questionnaire for assessing the effectiveness of teachers in a school. The value of alpha is 0 if the items are completely unrelated and 1 if they are identical. Results above 0.7 are commonly interpreted as showing that the items are consistent measures of the same underlying concept. Many statisticians consider that alphas above 0.9 indicate that the set of items includes some that are redundant, so that a smaller subset could be used without losing much if any information. Cronbach’s alpha for the three liberal democracy indexes, the three state capacity indexes, and even for all eight QoG indexes together fall in the range from 0.9 to 1.0.
Finally, the impression of strong convergence is further reinforced by a third statistical test, principal component analysis. That approach is used to assess the degree to which a number of measures of some concept can be reduced to a smaller number of principal components, or “latent factors.” In this case, one might anticipate that the eight indexes would reveal two latent factors, one related to liberal democracy and the other to state capacity. Instead, it turns out that nearly all of the information contained in the set of eight indexes can be attributed to a single principal component.1
Interchangeability. But convergence is not the whole story. Even a high degree of convergence does not mean that any two measures are interchangeable in the sense that they all give the same result when used to test a specific hypothesis.
Consider, for example, the hypothesis that, other things being equal, the institutions and practices of liberal democracy are supportive of strong state capacity. Clearly, the results shown in Table 2 are supportive of that hypothesis. However, Vaccaro finds that things change when we examine the narrower hypothesis that the relationship between democracy and capacity is nonlinear. More specifically, the hypothesis is that adding just a bit of liberal democracy to an initially authoritarian polity produces little if any gain in state capacity, but as democracy takes root more deeply, each additional liberalization gives a greater marginal boost to capacity.
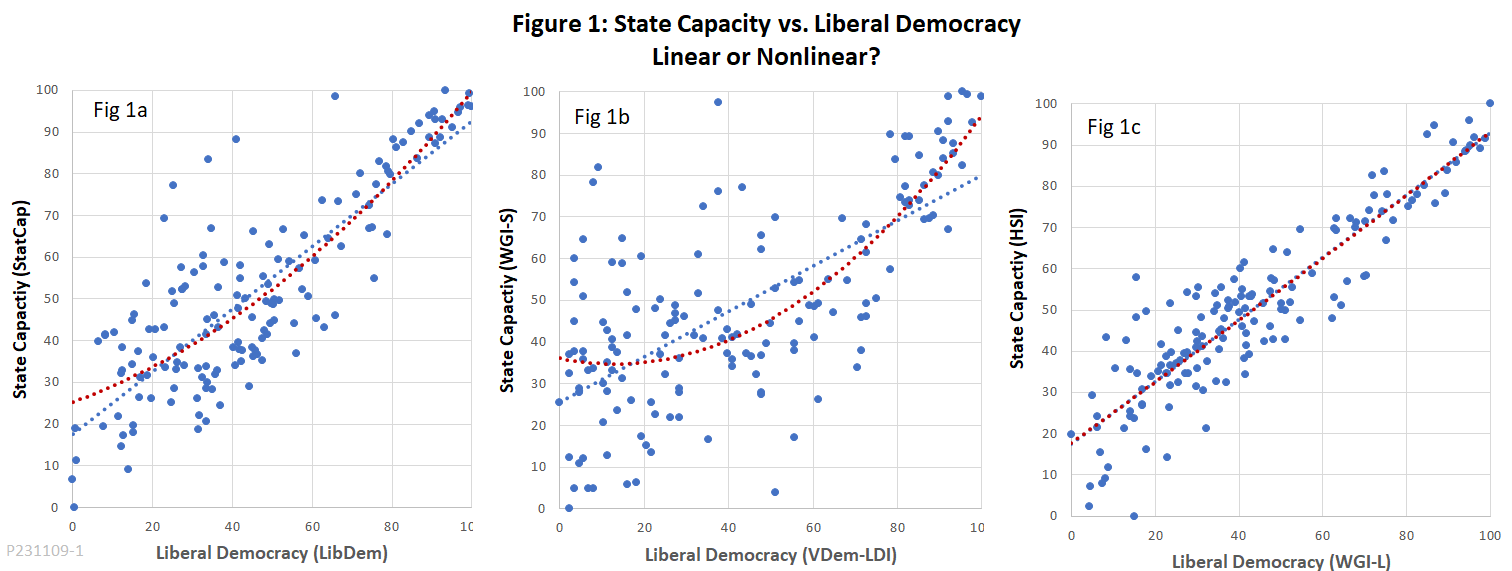
Rather than trying to replicate Vaccaro’s test of the nonlinearity hypothesis, I took a different approach. I looked at the nine possible pairings of the three state capacity indexes for the 153 countries included in this study with each of the three liberal democracy indexes. For each pairing, I fitted a curve using liberal democracy scores on the horizontal axis and state capacity scores on the vertical axis. A significant increase in slope moving from left to right would be consistent with the nonlinearity hypothesis, while a straight-line relationship would support its rejection.2
Figure 1 shows results for three of the nine pairings. In each chart, the fitted curve is shown in red while a blue linear trendline provides a reference. The results do not support interchangeability. Figure 1a, which uses LibDem and StatCap, shows a statistically significant curvature. The curvature is even more pronounced in Figure 1b, which relates VDem-LDI to WGI-S. However, Figure 1c, which uses WGI-L as the measure of liberal democracy and HSI for state capacity, shows no significant curvature. The red fitted curve coincides almost precisely with the blue reference line.
An examination of all nine pairings shows that most of the differences result from the choice of liberal democracy index. For all three state capacity measures, the regressions show moderate but significant curvature when the independent variable is LibDem or VDem-Lib, but no significant curvature for WGI-L. That suggests that the state capacity indexes, while not identical, are much closer to being interchangeable than the liberal democracy indexes. Keep in mind that these results are only illustrative. If applied to other hypotheses or to other samples from the underlying data, the degree of interchangeability might differ.
So much for the regularities. What about the outliers?
Up to this point, we have focused on one dominant regularity in the data, namely, the fact that on average, a country’s level of liberal democracy is a useful predictor of its state capacity. However, even a casual examination of charts like those in Figure 1 shows that although most countries cluster around a positively sloped line, there are conspicuous outliers. This section looks at what can be learned from the outliers, particularly those that fall far above the trendlines. At least since the 1930s, authoritarian leaders around the world have insisted that Western liberalism is the enemy, not the friend, of effective government. Although high-capacity illiberal states are the exception, not the rule, it is worth asking which countries do fit that pattern, and what, if anything, they have in common.
To sort the outliers from the rest, it will help to introduce a new term. I will call the amount by which a country’s state capacity score exceeds the value that is predicted by its liberal democracy score its capacity-liberalism anomaly (CLA).3 A strong, positive CLA fits the pattern of trains-on-time authoritarianism. The CLA can be computed either one-by-one for the nine possible pairings of the three state capacity indexes with the three liberal democracy indexes, or it can be averaged across all nine pairings.
Table 3 shows the top 10 countries by CLA among the 153 countries in the dataset. Column 2 shows the average CLA for each country across the nine pairings. The remaining columns show which countries made the top 10 for each individual pairing, with the numbers in parentheses showing their rank within that pairing. Only one country, Qatar, makes the top 10 for all nine pairings. In addition to the countries shown, 18 others made the top 10 list for at least one pairing.
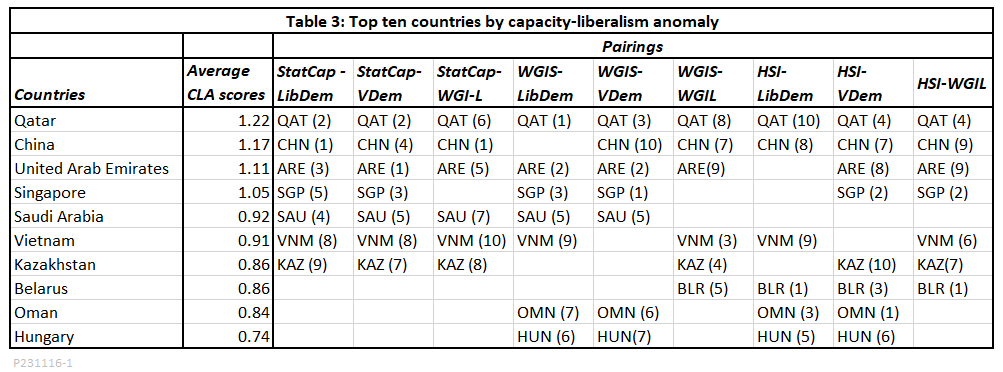
Certain shared traits seem to predispose countries toward the high-capacity illiberal pattern. Five of the top 10 have communist or post-communist political systems and five are major oil exporters. (Kazakhstan falls in both groups and Singapore in neither.) Three of the top four — Singapore, the United Arab Emirates, and Qatar — have state capacity scores in the top quartile among all 153 countries, ranking 9th, 27th, and 28th respectively. China’s state capacity, in contrast, ranks a much less impressive 46th out of 153, behind such competitors as Botswana, Malaysia, and Bulgaria. China’s high CLA is due less to exemplary state capacity than to a dismal ranking of 119 on liberal democracy, which places it right between Djibouti and Russia. Singapore and Hungary are the only countries among the top 10 by CLA that have positive average liberal democracy scores.4
It is worth noting that the agreement on CLA rankings is far from complete. Even Qatar, the only country that makes the top 10 in all nine pairings, has rankings for the individual pairings that vary all the way from first to tenth. The inconsistency of top 10 rankings provides additional evidence of less than complete convergence and interchangeability among the QoG indexes.
More can be learned about the CLA outliers by looking beneath the broad QoG indexes to their constituent elements. For example, the benchmark LibDem index includes components representing limited government, quality of market institutions, personal freedoms, and procedural democracy. All of the CLA top 10, even relatively liberal Singapore, have negative scores for personal freedoms and procedural democracy, that is, scores below the global mean of 0. However, on limited government and market institutions, their performance is more varied. Singapore and the UAE have very strong scores for both of those elements. Qatar and Saudi Arabia are a bit behind, but still positive. China, in contrast, scores below the global average for limits on executive power, and although its score for quality of market institutions is positive, its market institutions are weaker than any of the five petrostates in the top 10. Vietnam, Belarus, and Oman score below the world average on all four LibDem components.
Where to next?
This paper has aimed to encourage both academic researchers and would-be reformers to make greater use of quantitative data on quality of government. What have we learned that is of practical use? What are the questions that need further exploration? Here are some key points, as I see them:
First, not every discussion of state capacity or liberal democracy need take a deeply quantitative approach. Nevertheless, cross-country comparisons and within-country trends can provide context for even the most abstractly theoretical discourse or the most pragmatic policy analysis. As Vallier notes in his book on political and social trust, “we now have access to data on how social stability and cooperation are sustained, data that earlier social contract theorists did not have, and so we can speak more directly to the problems we currently face.”5
Second, some thoughts on how to choose among the many available measures of quality of government. Although broad correlations reveal substantial similarities among widely-used indexes, they are not fully interchangeable. Writers who choose to use QoG data, even casually, should be careful about the alignment between the available numbers and the meanings they attach to terms like state capacity and liberal democracy. For example, some writers on state capacity are primarily concerned with the ability of a government to execute the policies it chooses – what I have called administrative capacity. If so, it might not make sense to choose a measure of state capacity, such as StatCap, HSI, or WGI-S, that includes substantial weights for security capacity (war, crime, terrorism) and fiscal capacity (taxation, credit ratings, debt). Instead, it might be better for the purpose at hand to extract a single element or group of elements from those broader measures of state capacity. The same goes for liberal democracy. For some, democracy is simply a matter of holding free and fair elections. For others, procedural democracy is only one element of a broader liberal order that includes limited government, free markets, and personal freedoms. Finding the right data requires more than grabbing the first index that comes along with “democracy” in the title.
Third, although there is a strong convergence among the most popular indexes of quality of government, they are not fully interchangeable. Even if one index appears to be the best conceptual fit for the purpose at hand, it is worth double-checking to see if any hypotheses it appears to support hold up when tested against alternatives.
Finally, nothing said here is intended to denigrate nonquantitative analysis. Lord Kelvin overstated the case when he famously wrote that if you can’t measure what you are talking about, “your knowledge is of a meagre and unsatisfactory kind.” Even so, there are great opportunities for cooperation among theorists, hands-on analysts, and data junkies in advancing the frontiers of knowledge about democracy and state capacity.
With these points in mind, there is no end to the variety of topics waiting to be explored. How do specific factors such as women’s agency or political trust affect state capacity and liberal democracy? What can we learn from time-series data as compared to the cross-national approach taken in this paper? How can newly available data contribute to better understanding of long-running controversies such as the resource curse? Imagination is the only limit.
- For full results on all of these convergence tests, see Online Supplement B. ↩︎
- The curves were fitted using multiple regressions in the functional form y = a + bx + cx2, with x as the liberal democracy score and y as the state capacity score. For this set of regressions, the variables were normalized to a scale of 0 to 100. A positive and statistically significant value for the c coefficient was interpreted as consistent with the nonlinearity hypothesis. The regression as a whole showed a statistically significant relationship (p < .01) for all nine pairings but the curvature was significant only for pairings with LibDem and VDem-LDI as the independent variable. (For full results, see Online Supplement B.) ↩︎
- More specifically, a country’s CLA is the residual from a linear regression of state capacity on liberal democracy. The CLA scores in Table 3 are standardized so that the mean is zero and the standard deviation is 1.0. Any positive score thus shows unexpectedly high state capacity. ↩︎
- Full CLA rankings for the 153 countries can be found in Online Supplement B. For those who are curious, the United States falls close to the trendline, with a slightly positive CLA of 0.15. It ranks 21st of 153 in terms of state capacity and 18th in terms of liberal democracy. ↩︎
- Vallier, p. 16. ↩︎