
2016 has got off to a warm start. The January-March global average land temperature anomaly is +1.58°C according to the NASA GISS dataset. With three months of data already in for the year, several blogs have asked whether 2016 is already locked-in as being the hottest year on record (the third consecutive year this will have happened).
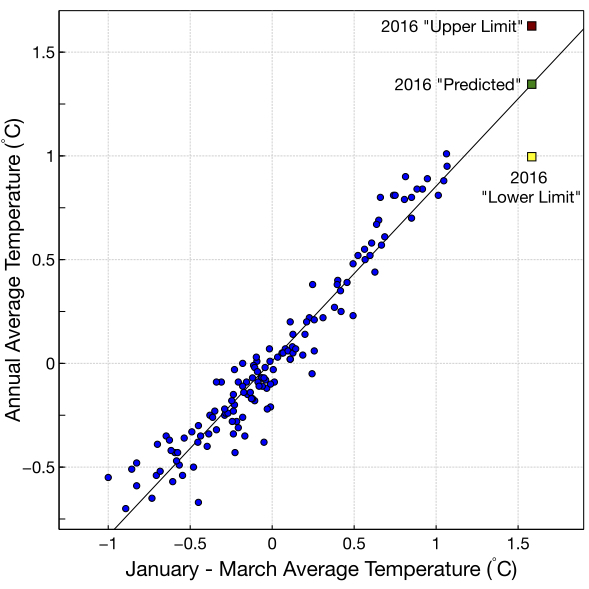
The relationship between the January-March global average temperature and the annual value is shown in the figure below, along with a basic prediction for 2016.
Firstly, we can see that the 2016 Jan-Mar (the green dot) value is exceptional, +0.52°C above the 2nd highest value from 2015. Secondly, based on the linear regression relationship between the Jan-Mar and annual values, the expected 2016 value comes in at +1.35°C, which would easily beat the 2015 value of +1.01°C. The red and yellow dots on the plot represent the range of uncertainty in the 2016 prediction.
The lower limit of the prediction for 2016 comes in at 1.00°C (a 100th of a degree below the 2015 record). For 2016 to not be the warmest year on record, the climate system would have to match the sharpest ever drop in temperatures from the Jan-Mar average. Not likely. In fact, the global average temperature has only been lower than the Jan-Mar average three times since the turn of the 21st century (2002, 2004 and 2007).
As I wrote before, the record breaking El Niño has had a large influence on the global average temperature. Because scientists expect a forthcoming transition to neutral or La Niña conditions, the 2016 temperatures will drop compared to the first three months of the year. Therefore, we might expect the 2016 annual average value to come in ‘below’ the prediction, but we still should expect—almost certainly—a record.
Why is this important?
Under global warming, a new record hot year is expected roughly 25% of the time (one in four years). The setting of three record years in a row is unprecedented in the 136-year record. After the present El Nino, we can expect temperatures to stabilize/drop slightly (relative to 2015-16). If global temperatures stay near these levels or continue to grow over the next decade, remains to be seen. But as long as we continue to increase CO2 levels, we can expect to see records on top of records.
Technical Note: This analysis uses NASA GISS land-only temperature for the analysis. It would be very similar using any of the other land-only or land and ocean combined datasets.


