
That President Donald Trump’s budget is problematic is something that most economists agree with.
There are, however, some prominent voices of dissent.
George Mason University economist Tyler Cowen, for example, suggests that the budget is not as problematic as you might think. According to Cowen, “the spending cuts are probably not needed. It would suffice to cut taxes only, and allow the economy to grow out of an even-greater budget deficit.”
Cowen’s larger point centers on the issue of economic growth versus real interest rates:
Critics are complaining that the budget assumes 3 percent economic growth to make the numbers work, but that suffices if “g” remains higher than “r.” In other words, under default assumptions about the American economy, the Trump budget is affordable, even if it balloons the measured deficit for some period of time.
…
There is no guarantee that the growth rate of the economy remains higher than the government’s borrowing rate. It is common in American history that government borrowing rates run 5 percent or higher, and the aging of the American population, or perhaps an unexpected catastrophe, such as a war, could lower the growth rate.
This is where I disagree.
To properly make the comparison between growth rates and borrowing rates, we need to adjust for inflation in the same way. Cowen’s argument arguably holds if we measure borrowing rates in nominal terms. Trump budget projections, however, are about real economic growth rates—which means that we should be comparing them to real borrowing rates.
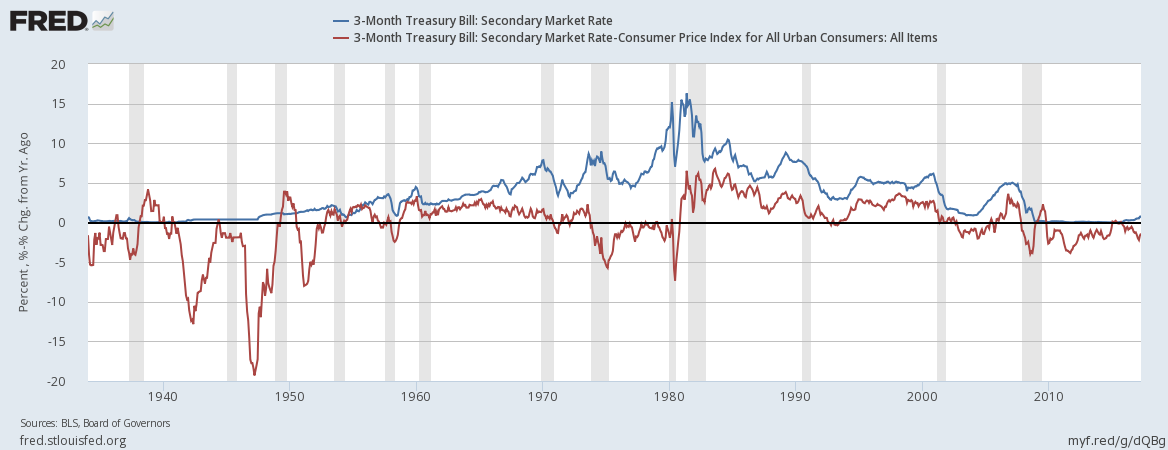
To illustrate my point, here is a chart of U.S. borrowing rates over the last 80 years or so:
The blue line is nominal borrowing rates. As you can see, it does go quite a bit above 5 percent, even outside of the stagflation of the late 1970s to early 1980s. However, the red line (real borrowing rates) actually never goes above 5 percent outside that period.
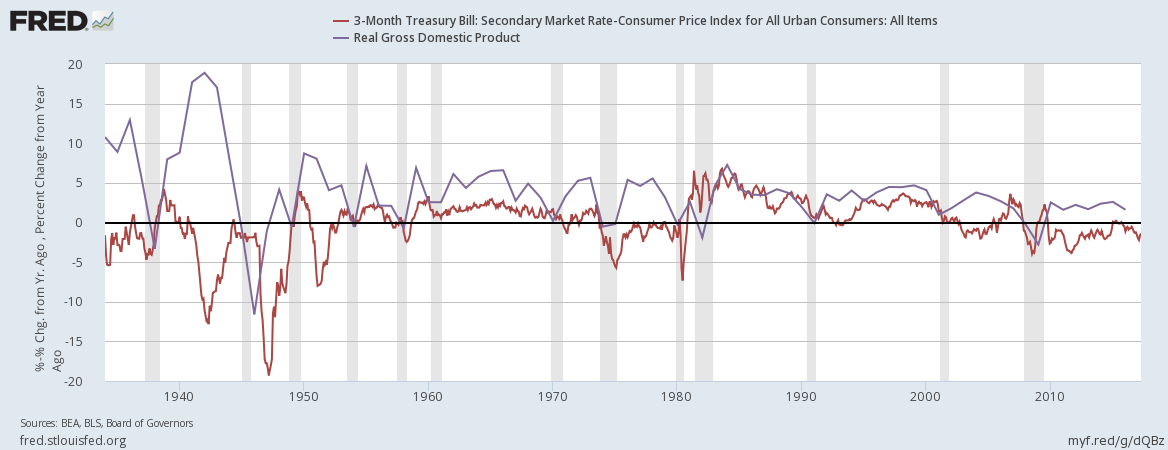
There is a reason for this. Real economic growth rates were rarely above 5 percent, and real growth and government borrowing rates are deeply and fundamentally related. Here is the comparison over the same period of real borrowing rates (the red line) and real growth rates (purple):
Not only do the two lines tend to run together, but the purple line serves as almost a cap on the red line. There are only three periods at which they have crossed.
The first was during the post-World War II recession. That dip has to be taken with a grain of salt because there were serious data problems with measuring massive demobilization and the return to private production during the war. It is believable that private value of what was produced just after the war was greater than the value of war machines. Still, we have to value weapons of war at whatever the federal government is willing to pay for them. Not only that, but keeping track of the new firms created in the wake of demobilization is no easy task. Firm birth and death is a classical statistical nightmare.
All of this is to say, it is unlikely that this data point actually represents a real relationship that was at play in the economy. In part, I doubt that because the other two times that the red line broke through had very special and similar circumstances.
The second time that real borrowing rates exceeded real growth rates—and this is one source of my doubt—was during the 1980s recession. This data point is important because we think we know enormous amounts about it. This, remember, was the recession created by then-Federal Reserve chairman Paul Volker specifically for the purpose of bringing down inflation. He started down this path in 1979, but the political backlash forced him into retreat until President Reagan gave him the go-ahead to proceed. What followed was the longest period of r > g (red above blue) on record—a consequence not of fiscal laxity, but of monetary stringency. We might also note that the recession was concentrated in financially sensitive sectors, with large declines in the profitability and employment in banking, insurance, and construction leading the way.
Red climbed above blue a third time in late 2006. This time, however, it wasn’t the Federal Reserve chairman who was tightening the strings. It was savvy participants in the market for structured financial products and the overnight repurchase agreements for which these products served as collateral. From the 1990s into the 2000s, a private international central banking system had grown up in parallel to the Federal Reserve. This provided liquidity to foreign banks as well as the offshore operations of U.S. banks. It was very much a decentralized alternative to the Federal Reserve, and it exerted a powerful influence over global finance, trade, and supply chain expansion. Whether this was a net positive or net negative remains an open question.
The failure of the private international central banking center to fully reconstitute itself may very well be behind our current malaise, but there is no doubt that its spectacular failure was at the heart of the late 2000s crisis. Regardless, r (government borrowing costs) rose above g (the rate of economic growth) just as the financial sector was experiencing a major contraction in private lending brought about by declines in liquidity from its central banking institutions.
Aside from the immediate post-war period (when, as noted, our data is unreliable) this is the only thing that has caused r > g in our history. And both times it led to a period of secularly declining government borrowing rates. This is precisely because the contraction of liquidity increases the markets demand and—some would say need for—government securities. When r > g, government debt is what you want to run to, not from.
The upshot is that the assumption that Trump’s budget can raise real GDP growth to three percent is far less grounded than the economics profession’s assumption that r will generally be smaller than g. This happens to be a longstanding empirical regularity.
The economic growth literature suggests that in a free market economy, r roughly equals g. It was this fact that made me doubt Thomas Picketty’s thesis even before his book was published. In everything he said and wrote, r > g played a major role. Yet r > g is not sustainable. If it was, then you could obtain infinite growth in finite time simply by investing the interest payments from r in private sector capital.
Not coincidently, you can understand this as the inverse of the thesis outlined by Piketty. Suppose r > g lasted in a normal—that is, non-infinite—economy. This would cause a long term divergence between financial claims on the economy (wealth) and economic productivity of the economy (income).
Since that can’t go on forever, it stops. That inability for asset prices to grow unmoored to underlying productivity is the fundamental driver of corrections in asset markets. This is true whether the assets in question are public, private, or just normative (e.g., kids expecting to inherit from their parents).
In short, the underlying assumption that the economy will grow faster than the interest rate on public debt is well-grounded, both theoretically and empirically. By contrast, the assumptions in Trump’s budget are grossly outside the mainstream, completely untenable and deserve all of the criticism they are receiving.


