On Wednesday, the American Enterprise Institute (AEI) was kind enough to invite me to participate in a public discussion about climate change and carbon taxes. Senators Sheldon Whitehouse (D-RI) and Brian Schatz (D-HI) led off the program to unveil their “American Opportunity Carbon Tax Fee,” after which my friend Benjamin Zycher and I had an opportunity to debate the merits of restricting greenhouse gas emissions. Ben’s comments can be seen online at the 43:30 mark and mine at the 56:41 mark. Questions and answers start at the 1:07:44 mark.
It’s difficult to have a conversation about policy responses to climate change without agreement that a policy response is warranted in the first place. So let’s consider a few of the reasons why many of my friends on the Right resist agreement on that score.
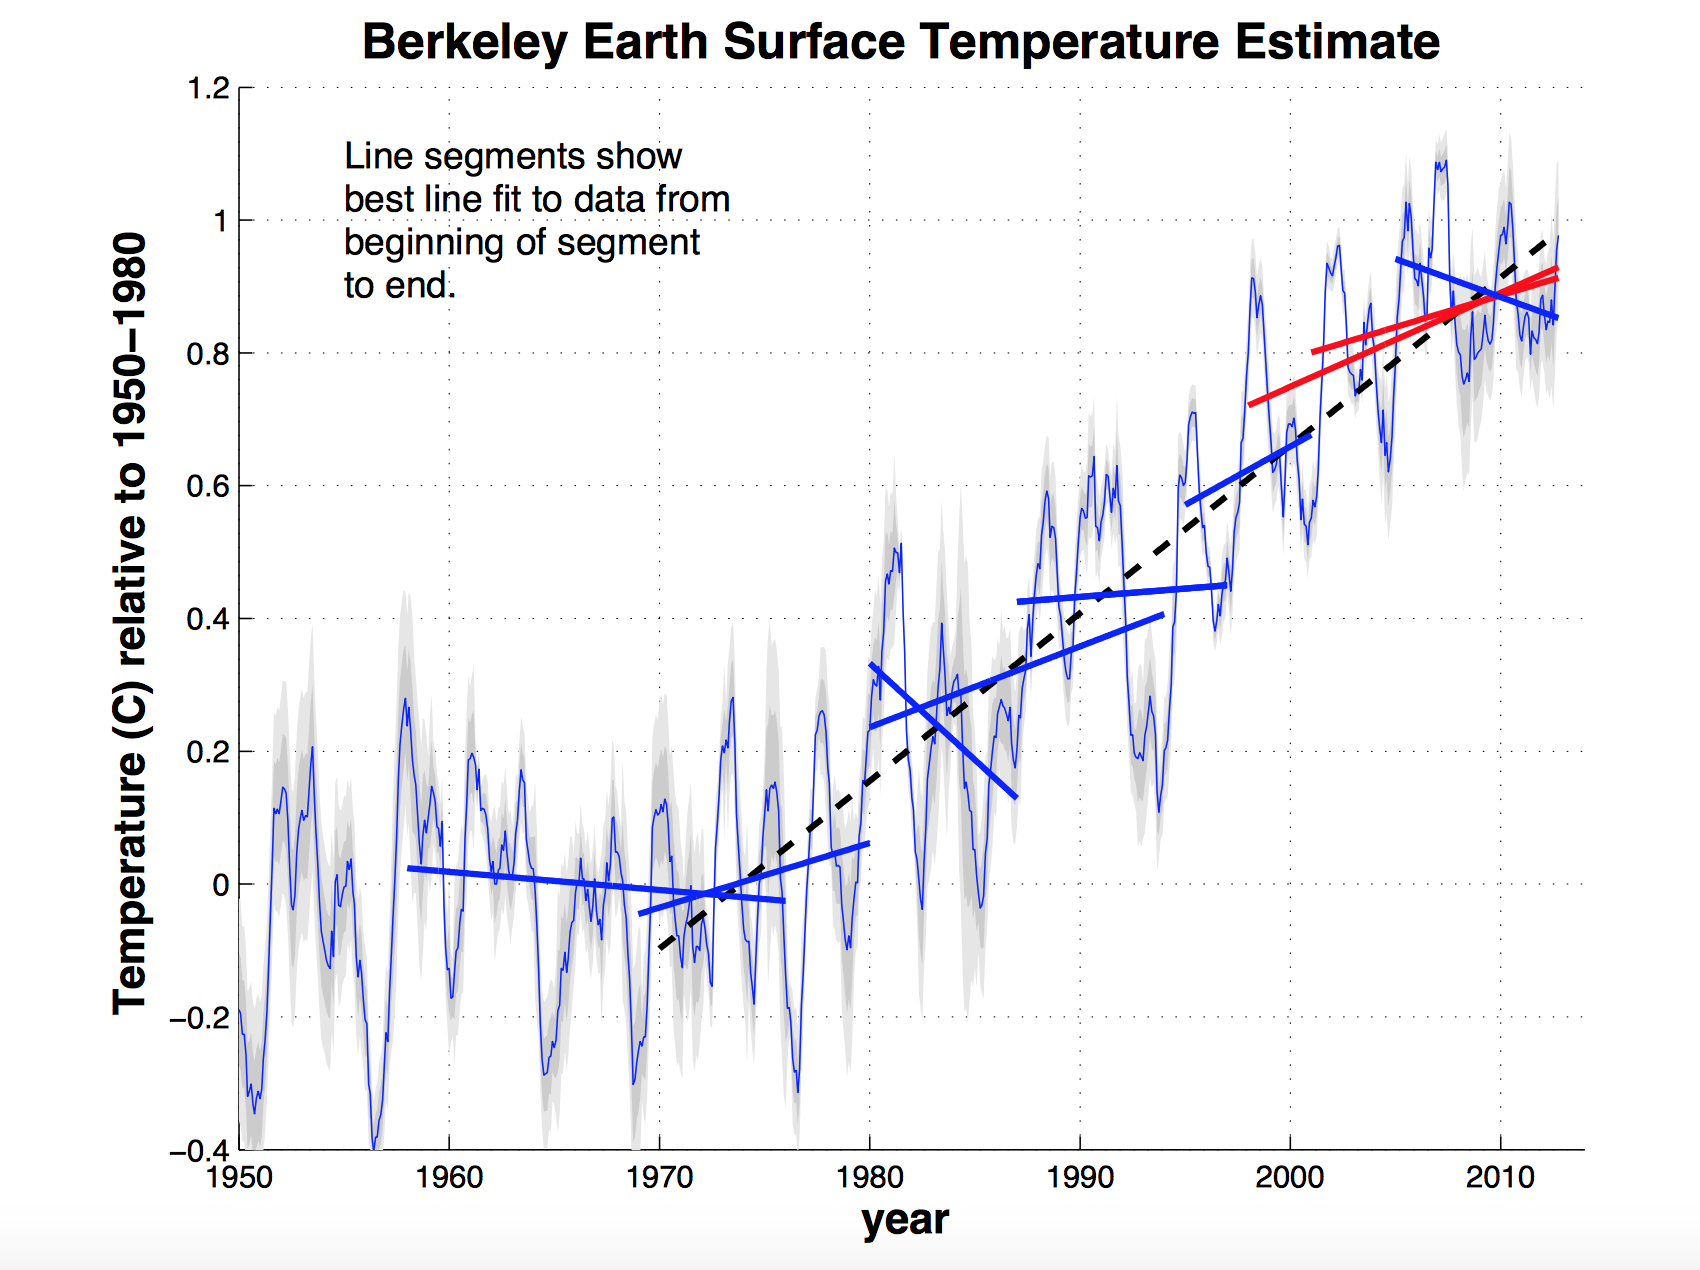
First, we hear quite a bit about how there has been no warming over the past 17 years (or some variation thereof), suggesting that a lot of scientists have been crying wolf. Let’s look at that claim (courtesy of Berkeley Earth) featuring Berkeley Earth’s land temperature record (the gold standard):
The thin blue line represents the Berkeley temperature record with grey showing the error bars. The dotted black line shows the temperature trend since 1970. The dark blue bars show statistically significant departures from the overall trend. And what do you know? There was indeed a statistically significant cooling trend over the past decade.
But consider the fact that, as the red bars demonstrate, one can tell a rather different story about recent temperature trends depending upon when we start that exercise. Regardless, given the complete data set, would a fair minded person really conclude that those who have long expressed concern over rising temperature should be eating their words?
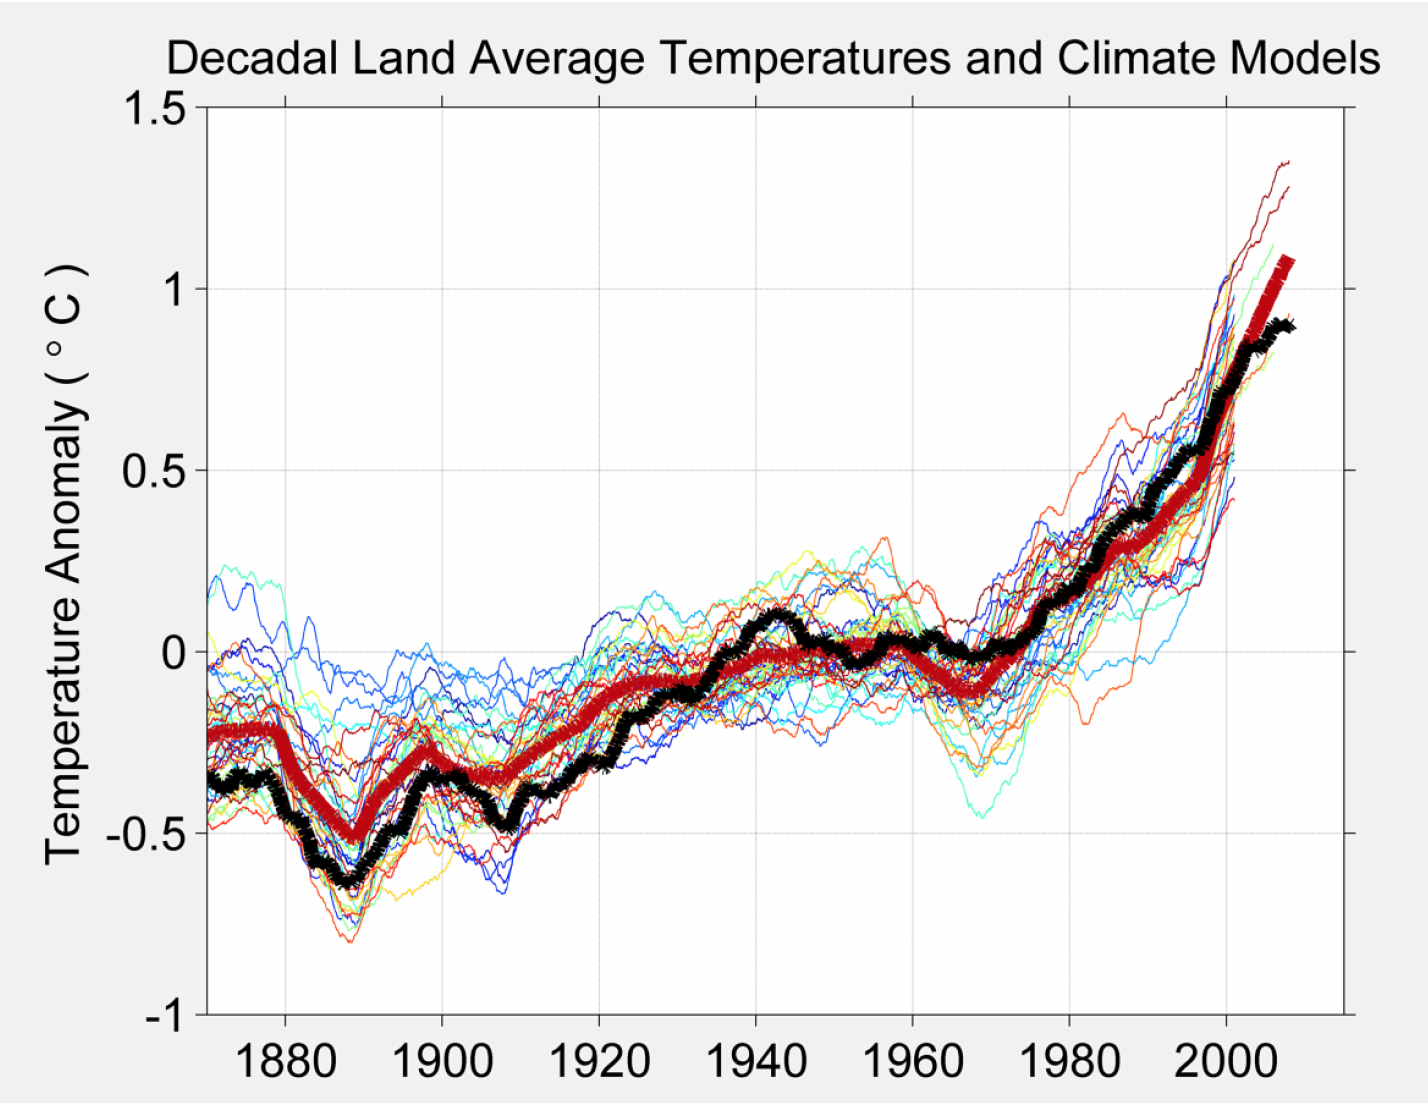
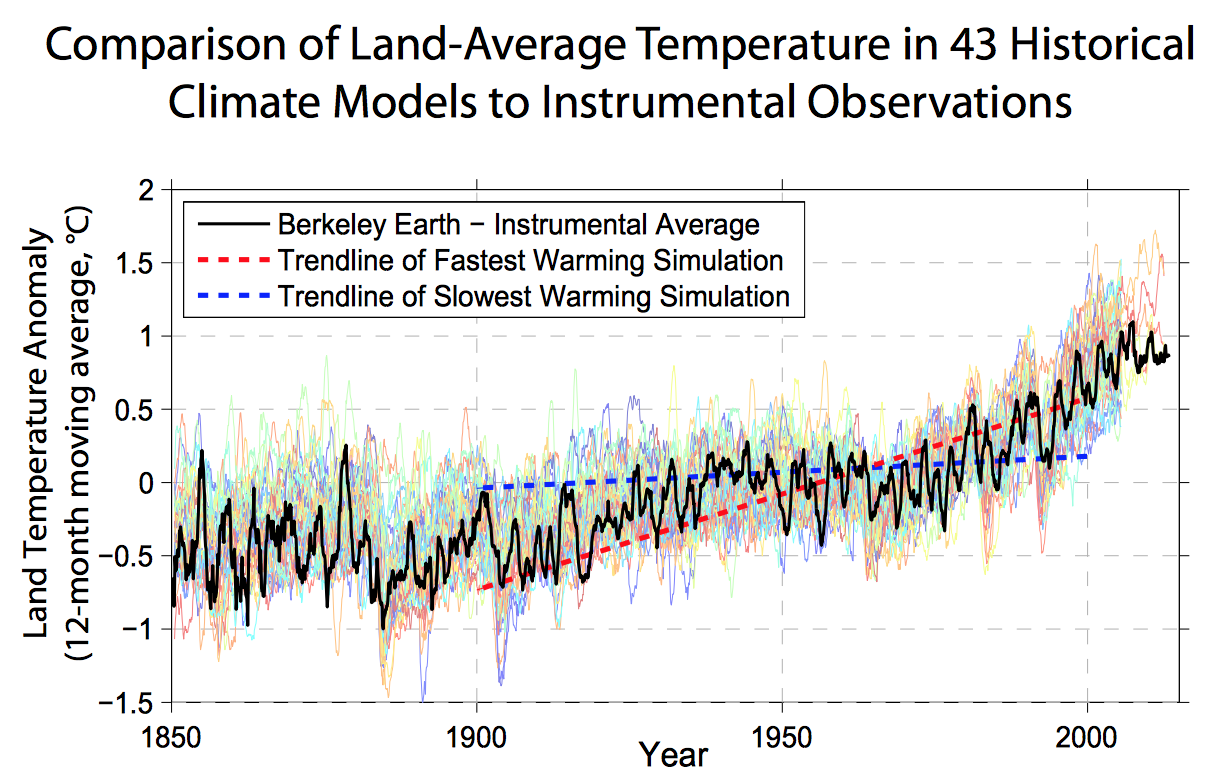
We also hear quite a bit from the Right about how the computer models have wildly over-predicted warming and thus should not be informing our policy going forward. Again, courtesy of Berkeley Earth, let’s see how the computer models used in the fourth IPCC report (released in 2007) perform when run against Berkeley Earth’s historical temperature record.
The multi-colored lines represent runs from the climate models featured in the fourth IPCC report. The heavy black line represents the Berkeley Earth land temperature record. The heavy red line represents the average of the various model runs. It would appear that the climate models used by the IPCC are now pretty good at replicating temperatures and are not, on balance, running hot.
In fact, Berkeley Earth’s analysis finds that the climate models with the greatest sensitivity to anthropogenic greenhouse gas emissions are more accurate than those with less sensitivity to industrial emissions.
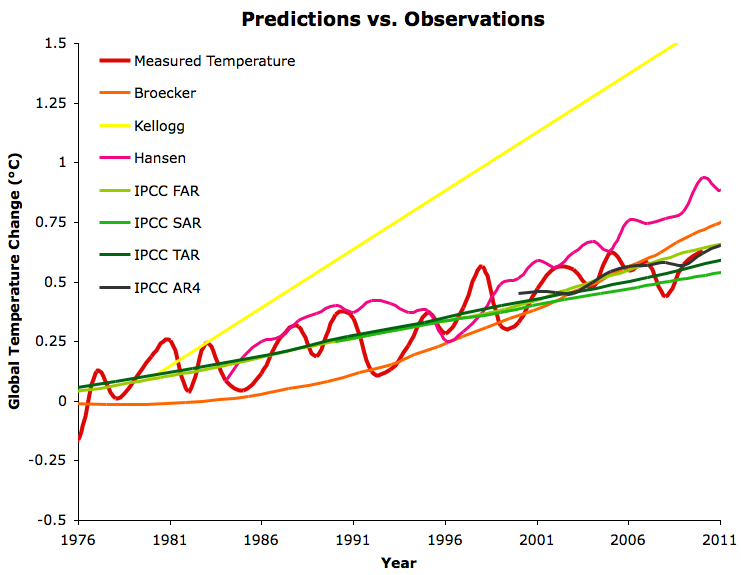
Let’s now go back in time, courtesy of the website Skeptical Science, and see how various predictions from the mainstream science community have faired against the subsequent temperature record.
The IPCC’s first (FAR), second (SAR), third (TAR), and fourth (AR4) projections (which can be found here) all track well with NASA’s surface temperature data (the red line in the above figure). So does Wallace Broecker’s 1975 projections (published in Science where the phrase “global warming” was originally coined), and James Hansen’s controversial 1988 testimony to Congress. The only projection that looks significantly off is from William Kellogg (published in 1979 in the Annual Review of Earth and Planetary Sciences).
Skeptics have, for the most part, avoided offering temperature projections of the sort found in the above figure. But to the extent they have offered predictions about temperature and climate, they have not done nearly so well.
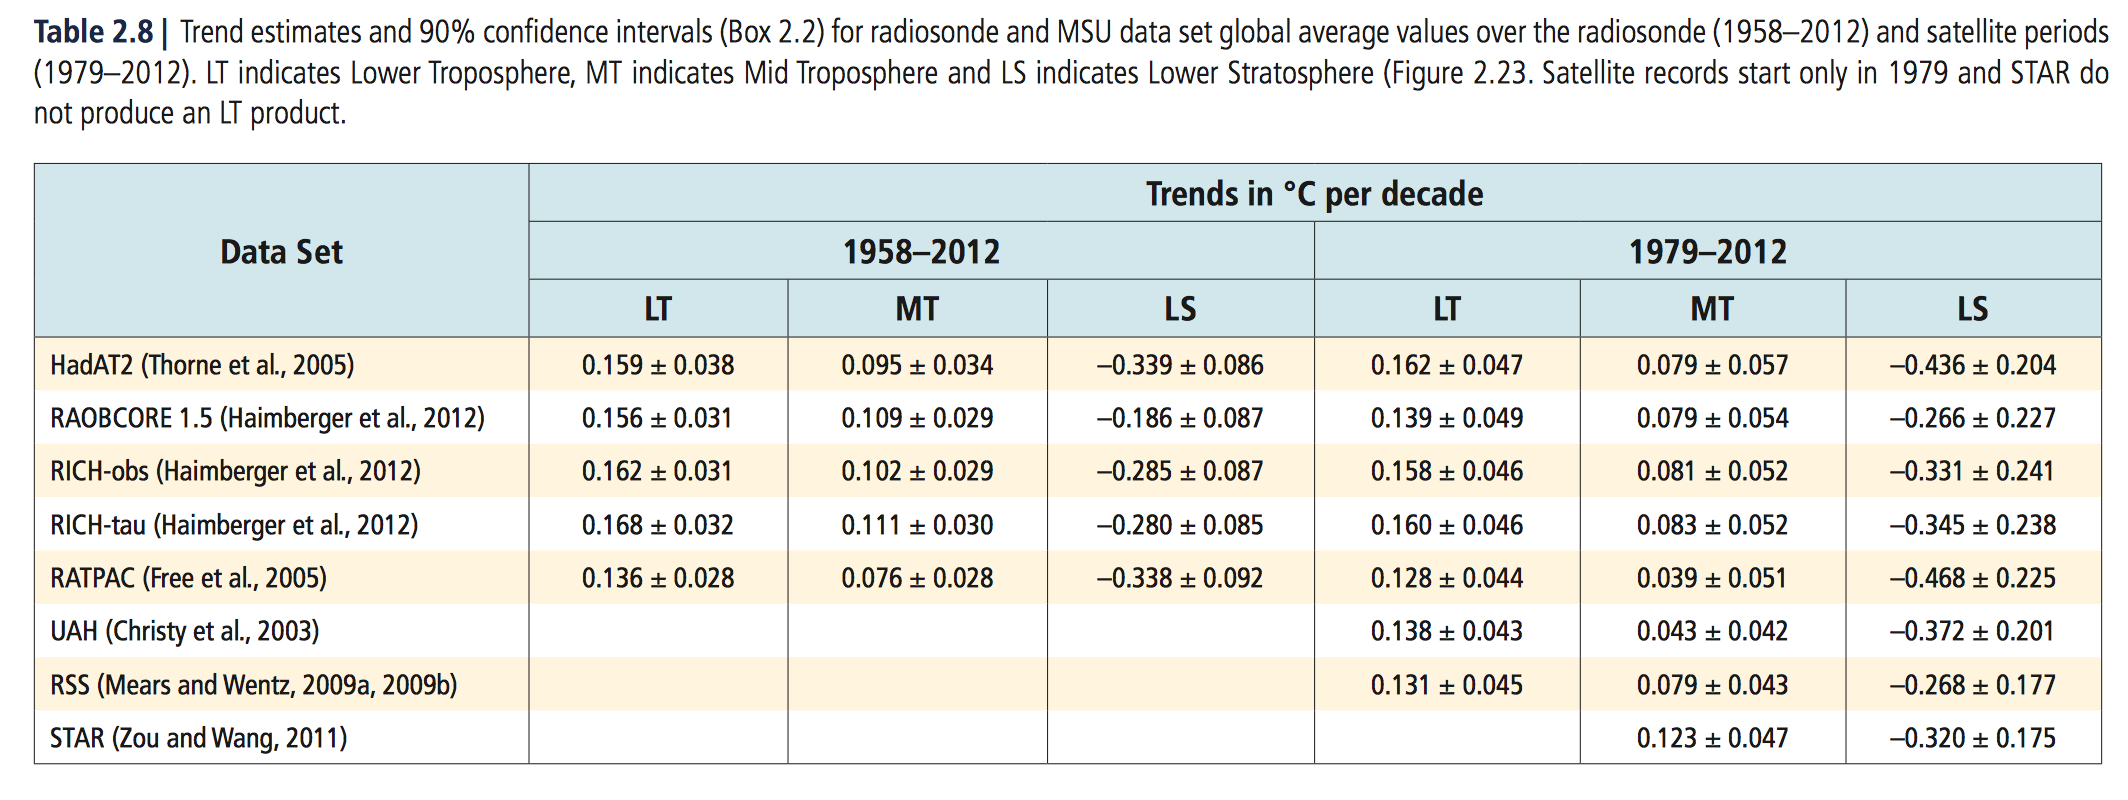
Alas, skeptics rarely put much stock in the surface temperature record. They often point to the satellite record to argue that warming (at least in the atmosphere) has been trivial to nonexistent. But the satellite record as seen below (taken from the fifth, and most recent, IPCC report) also shows exactly what we would expect to see if we accept the narratives offered by mainstream scientists.
Note that the lower stratosphere is cooling, just as we would expect from a world in which heat trapping gasses are preventing that heat from reaching the stratosphere. For a discussion of how this satellite data compares to the surface data–and why the two are not in conflict–decide how deep you want to go into the scientific weeds and then check-out the basic, intermediate, or advanced discussions over at Skeptical Science. Dana Nuccitelli over at The Guardian provides a popular account of how many climate skeptics (such as University of Alabama’s John Christy) misuse the satellite data.
Now that we’ve established that mainstream science is mainstream for a reason, perhaps we might more seriously consider what mainstream scientists think all this portends for the future. Their best guesses (from the fifth and most recent IPCC report) are:
- If we double the pre-industrial levels of CO2 in the atmosphere (from 280 ppm to 560 ppm) global temperatures will likely increase by somewhere between 2.7 degrees Fahrenheit to 8 degrees Fahrenheit over pre-industrial levels.
- We’re just north of 400 ppm now and have already experienced warming of 1.4 degrees Fahrenheit over pre-industrial levels, so we’re a little more than halfway to the lower bound of the temperature estimate for concentrations at 560 ppm.
- If public policy remains as it is today, the International Energy Agency (IEA) reports that CO2 concentrations will hit 700 ppm by 2100. That will likely increase global temperatures by somewhere between 3.6 degrees Fahrenheit and 11 degrees Fahrenheit.
- The word likely, in IPCC parlance, means a 66 to 90 percent chance. Accordingly, there is a 10 to 34 percent chance that warming will be lower than—or greater than—the spreads reported above. Alas, given observed warming to-date, there is more room to the right of those temperature estimates than to the left.
Warming by 3.6 degrees Fahrenheit over pre-industrial levels would take us into uncharted climate territory and raise the very real specter of climate catastrophe. Warming at the higher ranges of the projected likely outcomes, even without the aforementioned catastrophic events playing out, would prove economically and environmentally devastating. Warming above the range of likely outcomes (which has about a 10 percent chance of occuring according to Harvard economist Martin Weitzman) would produce almost unimaginable disaster.
So what do we do about this? This is the point at which a discussion about policy responses ought to begin. Without a common appreciation of the nature of the problem, however, no intelligent policy conversation can get underway.

