
This week, Texas Senator and Republican presidential candidate Ted Cruz chaired a hearing in the Senate Commerce Committee’s Subcommittee on Space, Science and Competitiveness. The hearing, “Data or Dogma: Promoting Open Inquiry in the Debate over the Magnitude of Human Impact on Earth’s Climate,” featured testimony from three scientists who are skeptical of the case for action to address climate change (Prof. Judith Curry of Georgia Tech, Prof. John Christy of the University of Alabama Huntsville and Prof. Will Happer of Princeton University), one mainstream climate scientist (Prof. David Titley of Penn State University), and talk radio personality and author Mark Steyn.
Senator Cruz closed the hearing with seven facts that he argued went unrebutted by witness testimony or questions from Democratic members of the committee.
Let’s break down Cruz’s seven facts and provide some context that we didn’t see in the hearing.
1. Carbon dioxide, rather than being a pollutant, is good for plant life.
Plants need CO2 to grow. Thus, absent other limiting factors, more CO2 can help plants grow more. Experiments which subject plants to elevated CO2 show that the turbo boost doesn’t necessarily last when other limiting factors take hold.
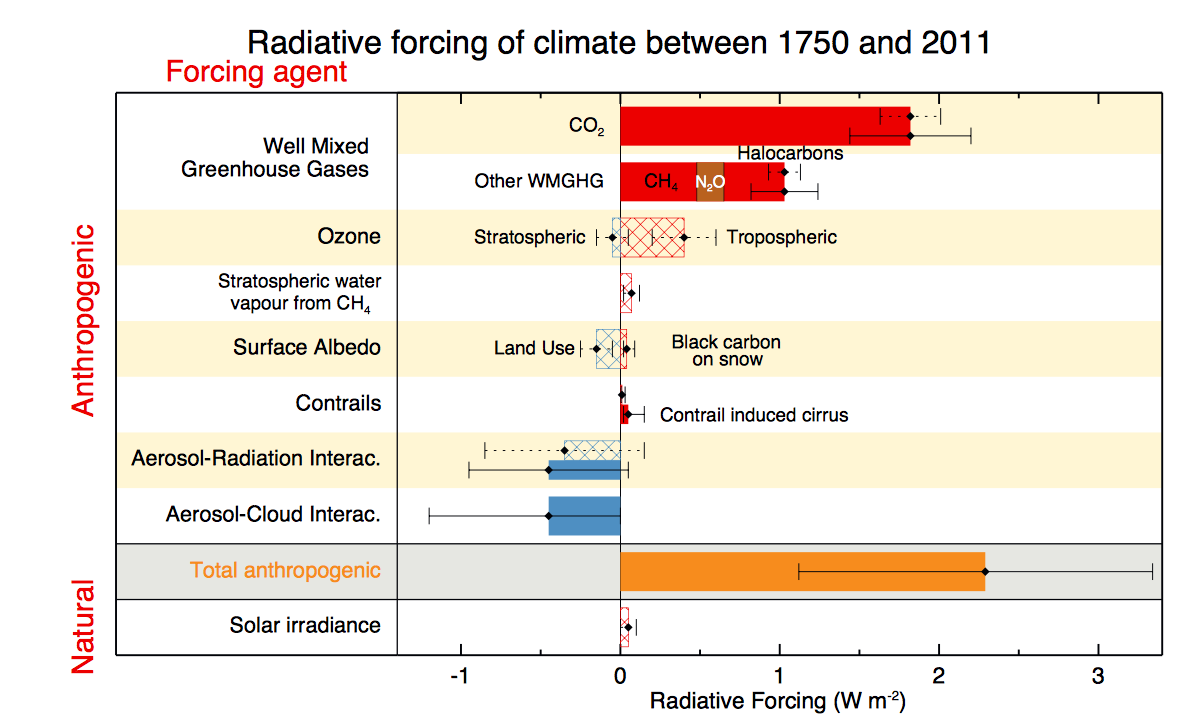
But increases in atmospheric CO2 also change the radiative balance of the earth. The chart below shows that this positive heating effect compared to other human influences on the heat balance of the atmosphere.
Figure 1: Estimates of the radiative forcing change show the role of CO2 in heating the atmosphere relative to other factors. Image Source: IPCC AR5
That radiative effect and the risks of climate change are scientifically verifiable. That CO2 can be considered a “pollutant,” at least under the Clean Air Act, has already been decided by the Supreme Court.
2. The Earth, right now, is greening.
Recent evidence says that the mass of land plants is growing. A mix of factors are contributing to that trend, such as reforestation of large tracts of land and increasing plant growth in newly viable regions (like formerly frozen polar areas).
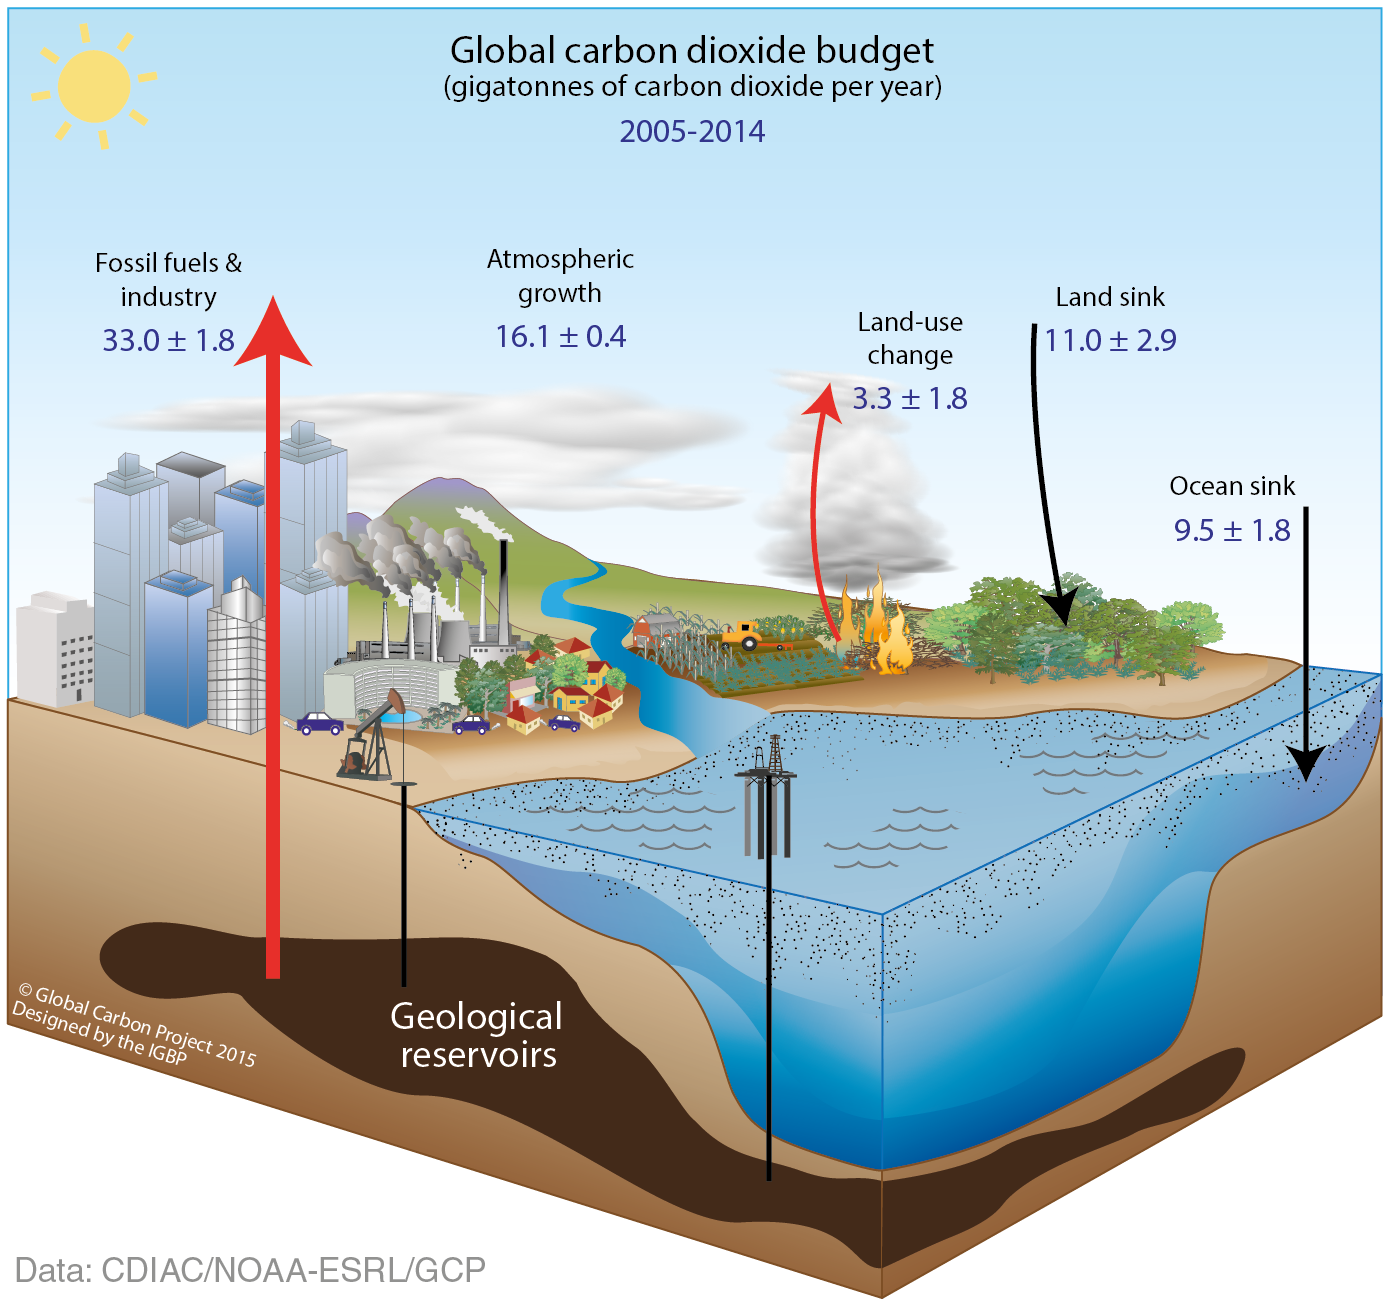
There is a carbon benefit from plant growth. Right now, the growth of forests and land plants is capturing CO2 from the atmosphere and slowing the increase in atmospheric CO2 concentrations from deforestation and the burning of fossil fuels. But it’s only slowing that rate. Data show atmospheric CO2 continuing to climb with the rampant burning of fossil fuels and continued deforestation. Here is what the carbon dioxide balance of the atmosphere has looked like for the last decade.
Figure 2: Data show that CO2 removed from the atmosphere by plant growth does not compensate for fossil fuel emissions. Image Source: Global Carbon Project
3. For significant periods in history, there has been markedly more CO2 in our atmosphere, and that was prior to the industrial revolution so it could not have come from the burning of fossil fuels.
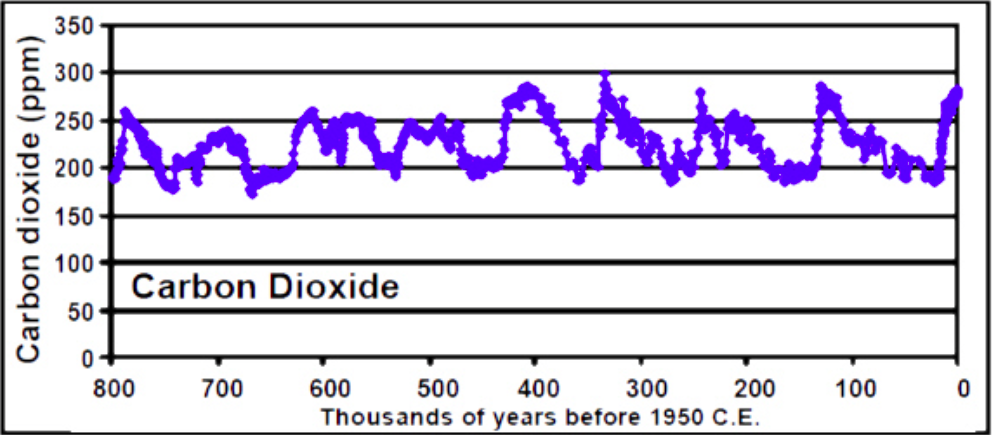
Natural fluctuations of CO2 are well documented and we are continuously learning how climate change deep in earth history can inform present day changes. But CO2 at about 400 parts per million, as it is now, is unprecedented in human history. We know this from measurements of CO2 taken from ice cores. Data from Antarctica show that CO2 in the atmosphere did not exceed 300 parts per million for at least the last 800,000 years.
Figure 3: Ice core records show atmospheric CO2 was lower than today for last 800,000 years. Image Source: Oak Ridge National Lab
The level of CO2 we now have in the atmosphere is the result of the burning of fossil fuels (plus some other emissions sources). It would be higher if land plants and ocean waters were not removing it.
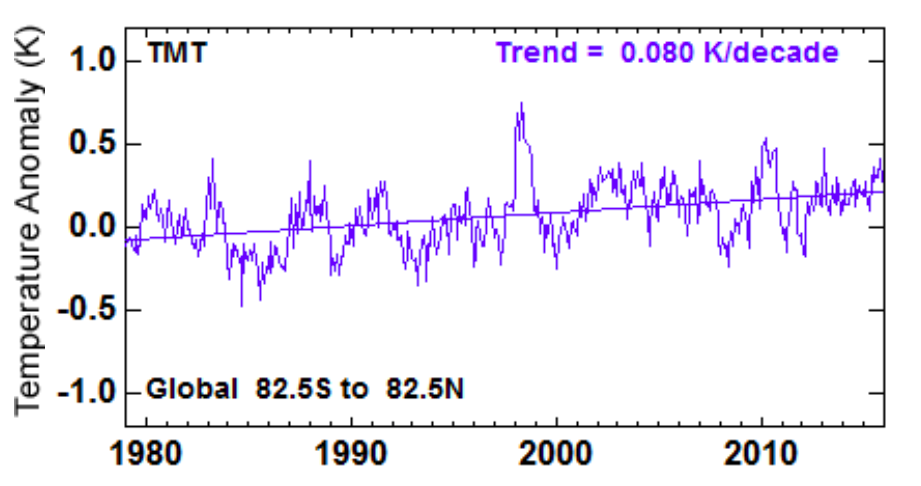
4. For the last 18 years, the satellite data and the weather balloon data both demonstrate no significant warming whatsoever.
Senator Cruz has invoked satellite data before. Last spring, Politifact found it less than credible evidence that climate change theory is wrong.
There was a strong positive El Nino in 1997/1998. Warm water in the tropical Pacific Ocean warmed up the atmosphere and drove record high temperatures (see 1998 in the satellite temperature data below). El Nino then subsided. It’s a natural process, but beginning a trend calculation with such an event obliterates the background trend in subsequent years. If you look at the full satellite record, dating back ~35 years, there is warming.
Figure 4: Satellite data show long-term warming in the troposphere. Image Source: Remote Sensing Systems
This blog post from Carl Mears, a scientist at Remote Sensing Systems that studies the climate with satellite measurements, provides a helpful deep dive into the topic. Mears presents a few factors that may contribute to that satellite trend, including how starting the trend at the big 1997/98 El Nino reduces the trend. The short version is that this 18-year trend does not dispel climate theory.
5. The satellite data and the weather balloon data are the best evidence we have of whether warming is occurring, and that evidence demonstrates that it is not.
There is a lot to this statement and it will likely be something we look at in the future. But there are a few things worth considering now.
- Satellite and weather balloon data show warming in the long-term (see the above chart). The issue of the last 18 years notwithstanding, these data do support the contention that the earth is warming.
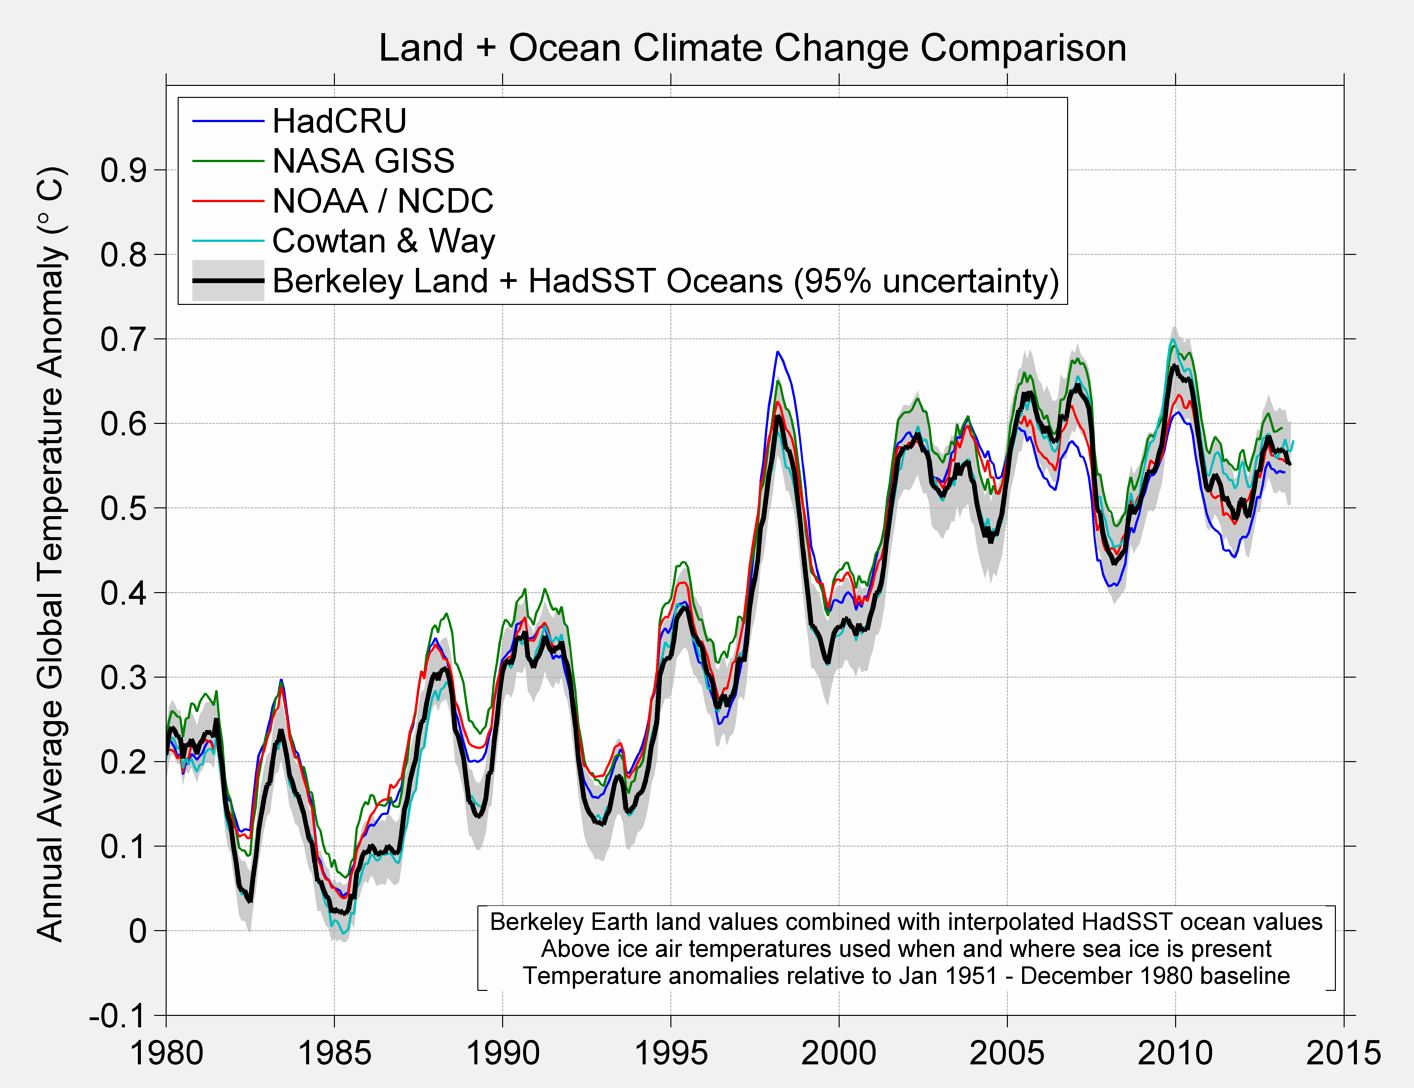
- Other datasets, including temperature records maintained at the surface and the ocean heat content show warming. The surface temperature record has been repeatedly, and skeptically, analyzed and shows unambiguous warming and increasing less support for a pause in warming over the last decades (see land surface temperature chart below). Ocean warming has been a subject of a recent blog post here from my colleague Sarah Myhre.
Figure 5: Five different analyses of surface temperature records show warming of the atmosphere at the surface level. Image Source: Berkeley Earth
- Satellite data, like surface temperature data, is not “clean.” It needs to be adjusted, bias-corrected, and suspected in certain regions (because of sea-ice and mountains). Satellites are vulnerable to sampling biases and orbital decay, which affect the consistency of measurements and the long term maintenance of the temperature record they produce. History has required all groups analyzing such data to serially revise their analysis techniques as understanding matured (UAH analysis is now on version 6). Even now, different reasonable analyses of this data show different results.
- Comparing lines of evidence is tricky. Surface temperature measurements and satellite and balloon measurements of the troposphere (higher up in the atmosphere) measure different things and they are subject to different problems.
All that doesn’t mean atmospheric measurements from satellites and balloons are worthless, unreliable, or uninformative. But the idea that they are more reliable than surface temperature records or they are more authoritative—or don’t need the same level of massaging—is false.
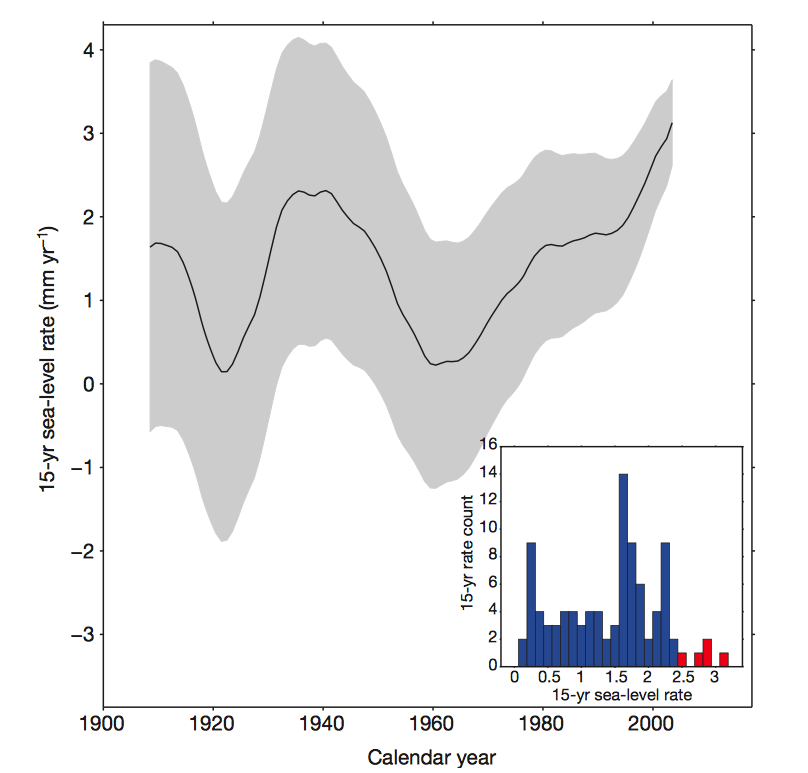
6. The seas were rising more in the first half of the 20th century, prior to the significant increase in carbon dioxide emissions, than they are now.
This graphic from a paper published this year shows the history of the rate of sea level rise over the last century. In the early part of last century, the rate is within the error of more recent estimates (grey shading), but the mean estimate (black line) is ~1 mm/yr lower. The box in the lower right shows that the rates of sea level rise in the most recent period (red bars) are the highest in the whole 20th and the start of 21st century.
Figure 6: The rate of sea level rise, calculated for 15 year segments, shows mean increases over the 20th and 21st century. Image Source: Hay et al. 2015
Sea level rise occurring before the bulk of CO2 emissions does not invalidate the human contribution to recent increases. In recent decades, scientists have developed sufficient monitoring capacity to understand how much of sea level rise is due to thermal expansion (from ocean heating) and melting land ice. Rising temperatures contribute to both of those and the temperature rise in the second half of the 20th century is attributable in no small part to human activity. If humans cause warming in the 21st century through additional emissions (and that is the expectation), then further global mean sea level rise is also expected.
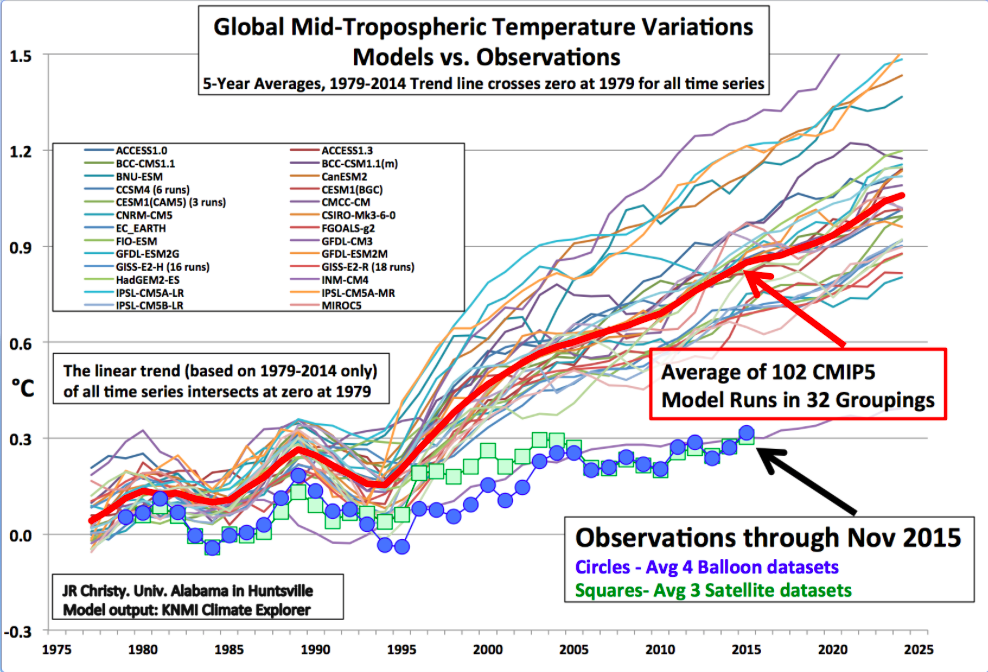
7. The computer models are profoundly wrong.
We’ve already looked at a similar argument that computer models are profoundly wrong in terms of surface temperature and found them wanting — with a combination of less dramatic factors influencing the divergence. Overall, climate models have been fairly successful at simulating the history of surface temperature warming (both in warming rate and geographical details).
The testimony delivered by Dr. Christy challenged computer models’ ability to simulate temperatures in the troposphere — as measured by satellites and weather balloons. This was based on the following plot, which as far as I can tell has not been published in the peer-reviewed literature. It is not a flattering depiction of the ability of climate models to simulate these specific observations.
Figure 7: This comparison of tropospheric temperatures shows a divergence between climate models and observations. Image Source: John Christy Senate Testimony, December 8 2015
Scientists know about and are actively studying the mismatch in climate models and tropospheric temperature measurements. There are specific physical candidates that may explain the difference, for example volcanic activity, proper representation of ocean temperatures, and variability in ocean processes. These other phenomena provide possible explanations for the model data misfit that do not require dismissing climate models as being fundamentally flawed or “profoundly wrong.”
That doesn’t mean that such models are perfect and can’t be improved. Indeed, such misfit informs scientists how well they are doing and generally leads to improvement in understanding. But given the response from the scientific community to understand the divergence, it appears to be unstable ground for a summary dismissal of climate models. We’ll likely revisit this topic, as it is a long-standing critique from climate skeptics and an important test of climate models.


