
Last week, I wrote about a new paper that reported a strong consensus among scientific experts (those who work in climate studies) that human activities have driven most of the warming observed in the last half century. The level of agreement varies between 90 and 100 percent of experts in the field, depending on how one poses the exact question and defines expertise.
A common criticism of consensus-type studies is that science is not a show of hands or a democracy. Instead of the highest vote count, the best theory to explain the evidence wins. In that previous piece, I argued that almost all studies that make a quantitative statement about the level of human influence on the recent climate find that human influence accounts for just about all of the change we’ve observed since 1950.
Last month, the journal Climate Dynamics published another paper that finds an overwhelming human influence on the climate, by Aurélien Ribes and colleagues. In A new statistical approach to climate change detection and attribution, Ribes et al. introduce a new method for calculating the level of human and natural influence on the climate.
The test devised by Ribes et al. analyzes the output of climate models under the influence of multiple factors (increasing GHG concentrations, changing aerosol concentrations, variable solar insolation, and more). By looking at the effect of each factor individually, and their cumulative effect, one can calculate how much each contributes to recent warming. The novelty of this new method is somewhat technical, but the new test is meant to be more robust to errors in the climate models.
The headline finding is that human influences drove all of the 1.17 °F of global warming observed between 1951-2010. They report in Kelvin (K, a change of 1 K is about 1.8 °F):
Consistent with the last IPCC assessment report, we find that most of the observed warming over this period (+0.65 K) is attributable to anthropogenic forcings (+0.67 ± 0.12 K, 90 % confidence range), with a very limited contribution from natural forcings (−0.01 ± 0.02 K).
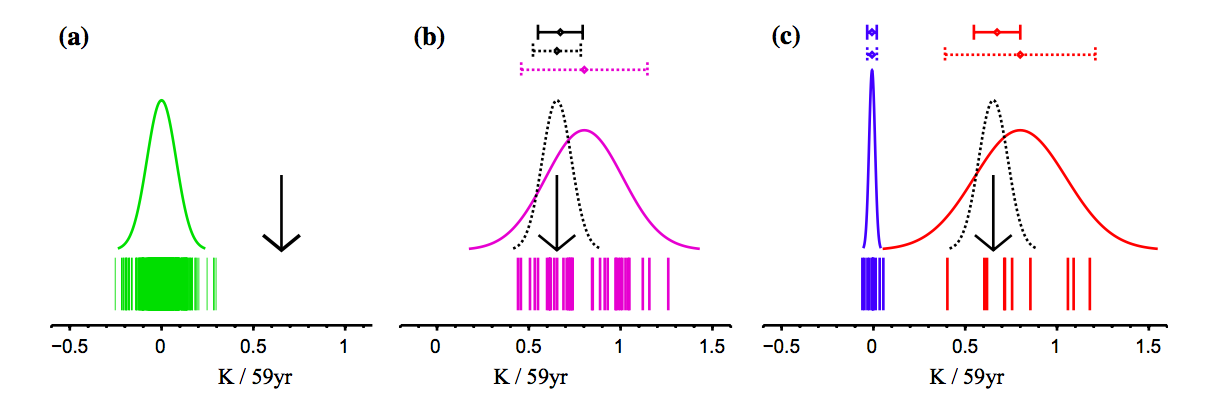
The central chart in the figure shows the dominance of human factors in explaining the recent warming.
Source: Ribes et al.
- Starting from panel (a) on the left, it shows the measured warming between 1951-2010 (0.65 K) at the black arrow. The green bars (and probability distribution) show that internal variability from the IPCC class climate models cannot explain such a warming.
- Middle panel (b) shows the total influence of natural and human forcings on the climate puts the simulated trends in purple over the measured trend.
- Panel (c) on the right shows the breakdown between natural factors in blue and human factors in red. This breakdown shows how little natural factors affected the observed warming (by cooling a bit).
The eagle eyed reader will note that in panels (b) and (c) above, the measured trend falls below the mean trend (peak of the distribution) calculated by the climate models. As we have discussed before, this is thought to be due to some combination of internal variability and forcing errors. The scale of interannual variability from the climate models, shown by the black distribution above, probably does not explain the entire difference.
Thus, this paper is another in a series that finds a very limited role for natural factors (accounting for a very small cooling) and a dominant role for human factors. While there is a persistent belief that the amount of observed warming which has been caused by human activities is up for debate, there is little to contradict these calculations in the literature.

