The Global Carbon Project (GPC) has just released a report on carbon emissions for 2017. The GPC was formed to assist the international science community to establish a common, mutually agreed knowledge base supporting policy debate and action to slow the rate of increase of greenhouse gases in the atmosphere.
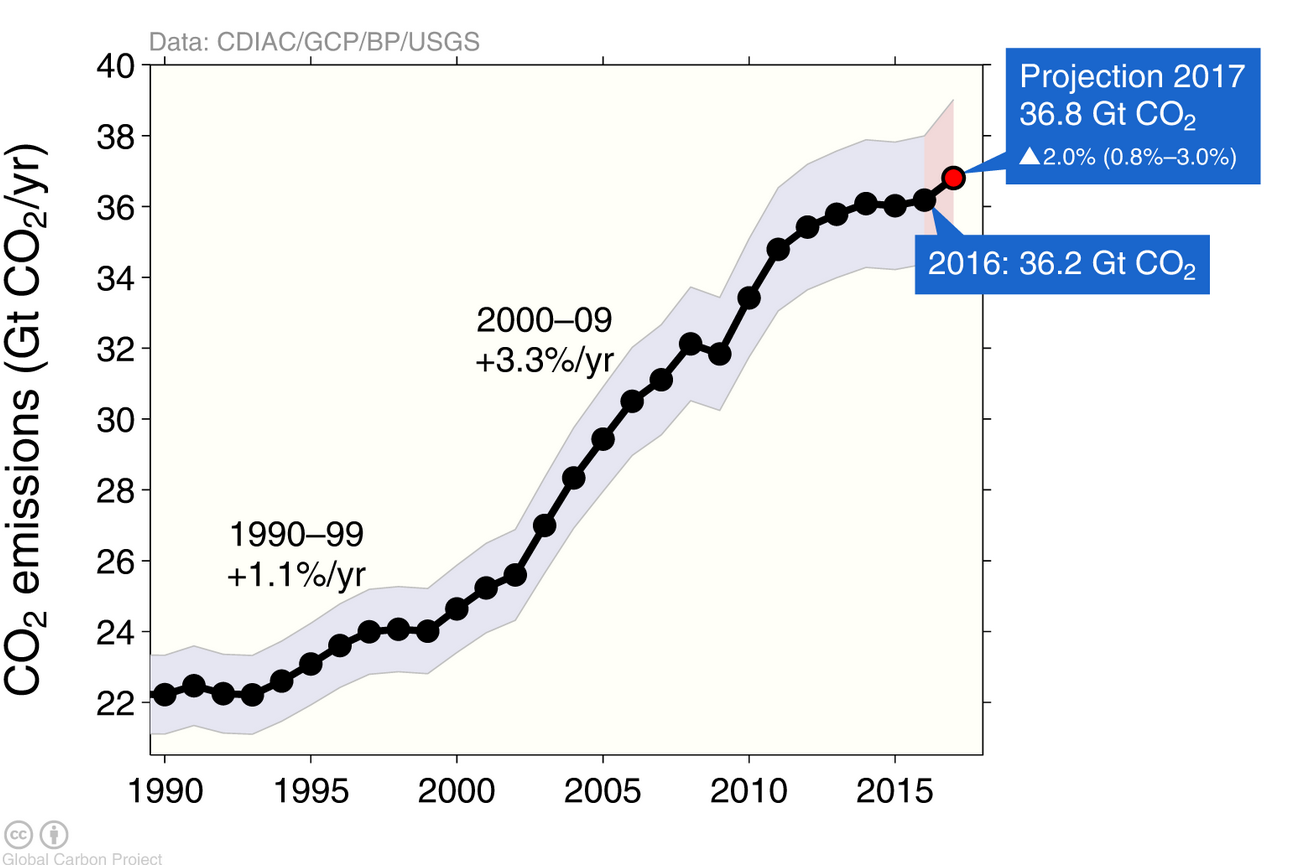
The headline number in the GPC report is disconcerting. After staying flat for 2014 through 2016, total carbon emissions are expected to resume their upward trend in 2017.
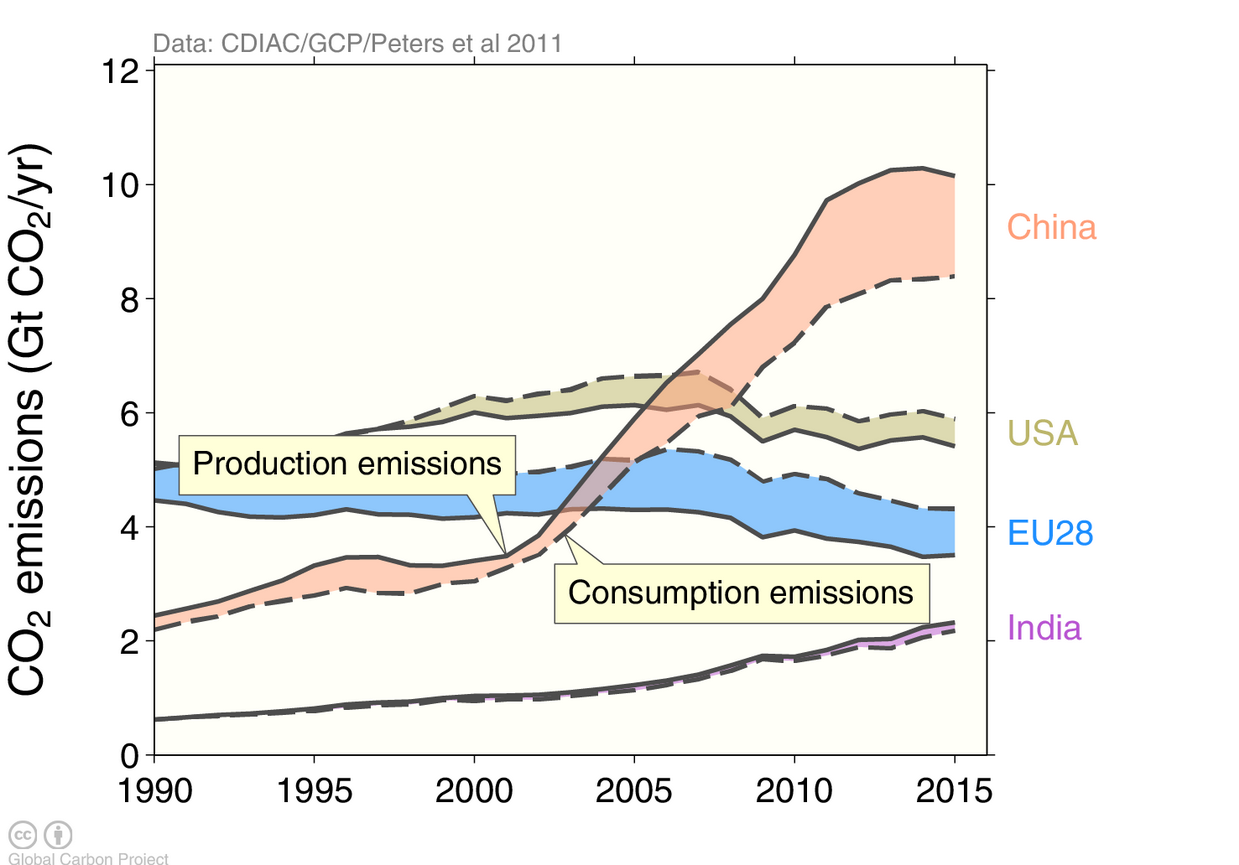
Not all the news is bad, however. The trend of CO2 output is downward in the three countries with the highest emissions, China, the United States, and the European Union. It is still steadily upward in India, the fourth-largest emitter. The following chart shows emissions in two ways, one of which attributes emissions to the countries where goods are produced and the other to the countries where they are consumed. Since many goods that are produced in China are consumed elsewhere, its consumption emissions are lower than its production emissions. That pattern is reversed in the US and the EU, which import many goods from China and elsewhere.
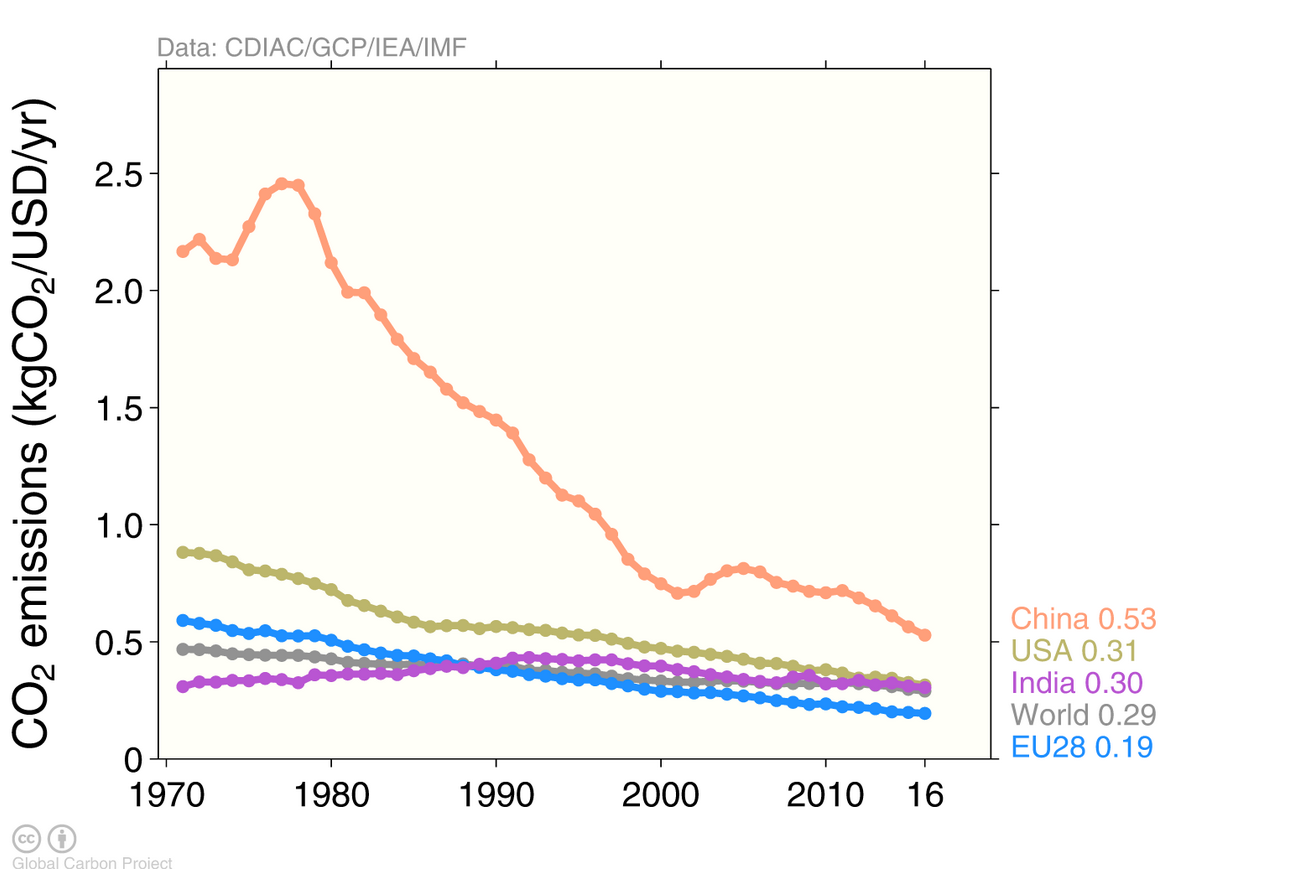
The biggest factor behind falling emissions in the top three source countries is a decrease in carbon intensity, that is, in carbon emissions per dollar of GDP. Decreased carbon intensity is in part due to cleaner technologies and in part to steady shift away from goods and toward services.
Wider adoption of carbon pricing, whether in the form of taxes or cap-and-trade, would accelerate the downward trend in carbon emissions per dollar of GDP. As the charts show, it would take only a modest additional push to achieve a global peak in carbon emissions, once and for all. Peak carbon would not mean an end to global warming, but it would be an important milestone.
View many more great charts here: http://folk.uio.no/roberan/GCP2017.shtml


