
Economists Jan De Loecker and Jan Eeckhout have a paper arguing that “mark-ups” have risen massively in the United States since 1980. By “mark-ups” economists mean the difference between what a business pays for the inputs it uses and what it charges for the products it produces. Firms in highly competitive markets are forced to lower prices until they just cover their costs, but businesses in more competitive markets — monopolists being the extreme example — are able to raise prices without losing all their customers. Thus, high markups can indicate weak competition in an industry, or in the language of economists: firms in that industry have lots of market power.
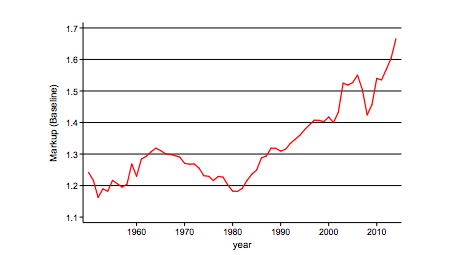
By Loecker and Eeckhout’s measure, average mark-ups have soared from 18% in 1980 to 67% today.
If that change is being driven by a rise in market power, then the fundamental nature of the American economy has changed over the last four decades. Which is the conclusion that the authors draw. They argue that this rise in markups explains some of the most disconcerting and perplexing trends in the U.S. economy. In particular, Loecker and Eeckhout suggest that rising markets explain: the long run decline in labor’s share of income; the decline in low-skilled wages; the decline in labor force participation; the reduction in labor market mobility both between firms and across regions; and the slowdown in productivity growth since 2008.
This is, needless to say, quite the claim. Do the authors have the goods to back it up?
Tyler Cowen is doubtful. Rohan Shah is less kind. My own take is nuanced.
On the one hand, the fact that the authors have put together a single explanation for multiple, contemporaneous puzzles makes me very reluctant to dismiss the work they have done. It is highly likely they have stumbled upon something. The question is, what exactly?
Here is the problem. When the authors said there had been a massive increase in markups and hence market power in the U.S. economy, it seemed as though they were going to tell a story about Apple, Goldman Sachs and maybe even Wal-Mart. That is not, however, where the action is.
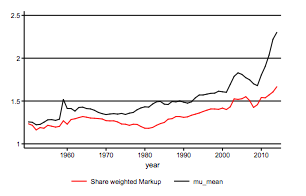
The graph below compares two different measure of the increase in markups in the economy.
The black line is the unweighted average markup over time. It is calculated by simply adding together the markups of each firm in the authors’ data set and then dividing through by the number of firms. The red line is the weighted average markup. It counts the markups by firms with a larger market share more heavily than those of smaller ones.
If the increase in markups was being driven by the dominance of large, very profitable firms, then we would expect the red line to be substantially above the black. That is, we wouldn’t expect small independent businesses to be increasing their markups. If anything they would face stronger competition and be forced to cut prices. Yet, small independent business greatly outnumber large mega-firms. By sheer numbers they dominate the unweighted average.
The unweighted average, however, is where we see the largest increase. The story this chart tells is one of intense competition among large multinational firms, but ever increasing market power by small business.
And that offers a clue as to what is truly happening. The following is purely hypothetical, but so far it is my best guess at how to square the data. In 1980 we had healthy ‘Main Streets’ all over the United States. Small and medium-sized businesses were in fairly robust competition with one another. Likewise local manufacturers participated in a nationwide marketplace in which each of them had little market power.
Over the next several decades, that economy was replaced by one of big box retailers and global supply chains. Those giant retailers actually brought even lower prices. The competition was so intense that the typical Main Street business couldn’t keep up. Manufacturers who already faced low profit margins in the national marketplace were completely driven out business by suppliers from around the world.
Yet, as intense as this competition was, it didn’t drive all small businesses out of business, and it didn’t mean an end to U.S. manufacturing. In particular, the businesses that survived were precisely the ones who couldn’t be undercut by big box retailers and global suppliers. They offered a specialized retail experience or a niche product, or perhaps they simply served a market that was otherwise hard to reach.
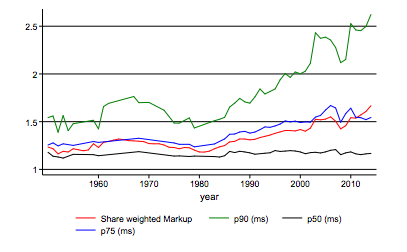
The following chart lends some support to this interpretation:
The authors break down the increasing market power by percentiles. The green line tracks the markup of firms in the highest decile. That is, those with markups higher than 90 percent of all other businesses. The black line tracks firms whose markup was at the median. The median firm saw virtually no change its markup over the entire period from 1950 to 2014. Instead, it seems that most of the action is being driven by the firms with the highest markups.
The sweeping away of the small generalized firm made room for the rise of increasingly specialized local businesses, offering what might think of as a more artisanal experience. These firms have increased markups, but those markups don’t represent a lack of competition. Instead, they represent a return to the particular skills or vision necessary to make a specialized product. Economists refer to this market pattern as monopolistic competition, and it is the source of variety that consumers in a wealthy developed economies desire.
If my story is correct, then the trend towards higher markups is indeed linked to the major changes sweeping the American economy. However, it isn’t the cause of them. Its another consequence of the massive changes introduced by globalism and the radical changes in retailing.
—
Karl Smith is the Director of Economic Research at the Niskanen Center


