
Jonathan Chait’s write-up of the Democracy Fund’s new Voter Survey hit close to home. Chait writes:
“Libertarians don’t exist.”
Well, obviously, they exist — just not in any remotely large enough numbers to form a constituency. It’s not just hardcore libertarians who are absent. Even vaguely libertarian-ish voters are functionally nonexistent.
The study breaks down voters into four quadrants, defined by both social and economic liberalism. But virtually everybody falls into three quadrants: socially liberal/economically liberal; socially conservative/economically conservative; and socially conservative/economically liberal. The fourth quadrant, socially liberal/economically conservative, is empty:
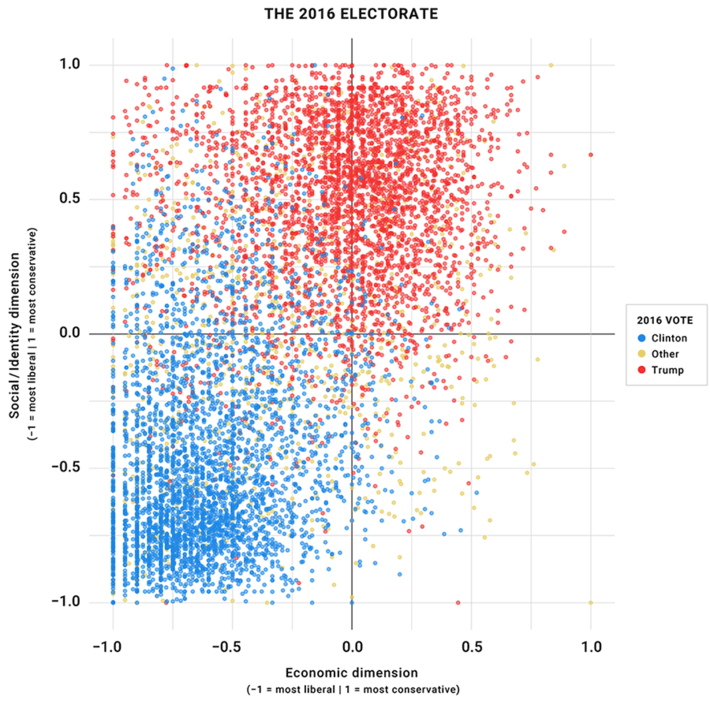
The chart was the real killer. Here in brutal graphic form was the truth that Libertarians command no significant portion of the electorate.
Yet, the more I stared, the stranger this chart seemed. It’s not just that the bottom right quadrant is empty. The dots along the top and left ends of the charts are smashed together. They don’t fade out gradually as data typically do. There is actually more mass up against the top and left wall than in the other quadrants. That pattern suggests the data have been significantly truncated. That is, some folks would have scored greater than 1 on social conservatism and many folks would have scored less than -1 on economic liberalism. However, the scoring procedure didn’t allow for that. Instead, it truncated these voters to the maximum allowable scores of 1 and -1, respectively.
Now, what that suggests is that 0.0 on this graph is not only the false center of mass, it’s also not the center of the range of opinion. Looking down the right hand line, only two—apparently heartless SOBs— actually maxed out the economically conservative scale. This was an online survey, and yet only two respondents were determined to be the most economically conservative.
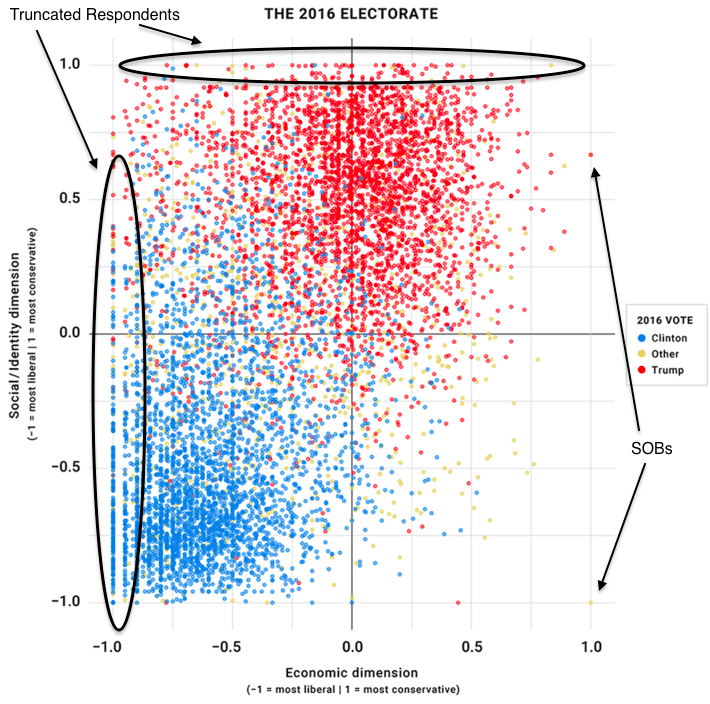
While it’s unclear whether these two respondents truly considered the extreme right position to be an accurate reflection of their ideology, what is clear is that they hardly represent the hardcore of free market philosophy. In the libertarian quadrant, no one else even comes close to our extreme respondent. In the conservative Republican quadrant a few other respondents get close, but the clear limit of opinion seems to be relegated to 0.75 economic scale.
It appears that the questions were scored such that the extreme far right wing takes were marked as +1, whereas relatively center-left takes were marked as a -1. That is why almost no one scores as a +1 economic conservative. Yet, lots of folks truly ought to be beyond a -1 economic liberal.
To really get into that, we’ll have to dive deeper into the data. But first, let’s look at what a mild re-norming of the chart looks like. Simply shift the axises to the left by one value, so that the far right edge of the chart lines up with what looks to be the actual limit of conservative opinion.
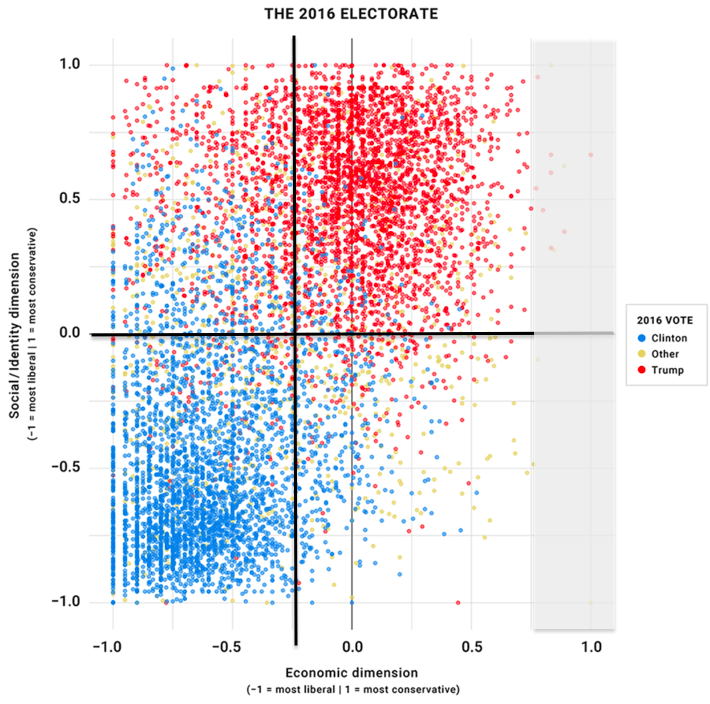
First, the classic polarization between Democrats and Republican re-emerges. The center-of-mass of the Republican red dots is decidedly socially conservative and leans economically conservative. The center-of-mass of the Democratic blue dots is decidedly socially liberal and leans economically liberal.
Second, while there are still—after mild renorming—more populists than libertarians, libertarians definitely exist, especially as you get closer to the center axes.
Third, and this is something that rings true, libertarians are more likely to be Clinton voters than Trump voters, though many voted for a third party candidate.
Turning back to the data, Lee Drutman’s density plot of the responses seems to confirm our working hypothesis.
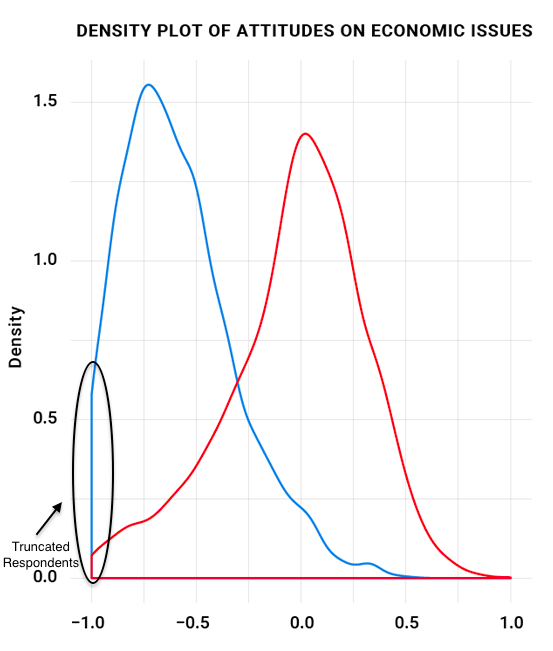
What we see here is that while the right hand tails of both curves taper off more or less like traditional bell curves, the left hand sides of both the red and blue curves hit the wall at minus one. If we were to extend the scale outward both the red and blue lines would run well past minus one. What this all suggests is that the scaling misrepresents the center-of-opinion. Center-of-opinion looks to be somewhere around .325 on this scale.
Now, it could be that the center-of-opinion in America has simply shifted so far to the left that anything like free-market philosophy is held only by an extreme fringe, and a significant chunk of national opinion is literally off the charts based on the traditional left-right divide. I suspect, however, that this result is the artifact of the scaling procedure. As Chait points out, these types of identification charts are common among libertarians and are notoriously sensitive to the particular questioning. To see which is more likely, I will have to go into the raw data itself, and that is for another post.