
On November 30th, Dr. Benjamin Zycher of the American Enterprise Institute compiled a set of climate facts and figures to guide policymakers in the run-up to the COP-21 meeting in Paris. Many of the arguments made by Zycher are commonly forwarded by climate skeptics, so they are worth a close look.
Today, we’ll examine his argument that the global temperature record is ambiguous. Zycher says that while a warming trend has been observed since the 19th century, it is unclear how much of that warming is attributable to human causes. He argues:
- Temperatures have been increasing in fits and starts since the end of the little ice age;
- Conclusions about the degree of human influence on the climate are based on the predictions of climate models, which are unreliable because;
- Climate models do not simulate observed natural variability and have not correctly predicted climate trends in the last ~20 years.
We’ll take a look at each of these arguments in turn.
How much warming do we measure?
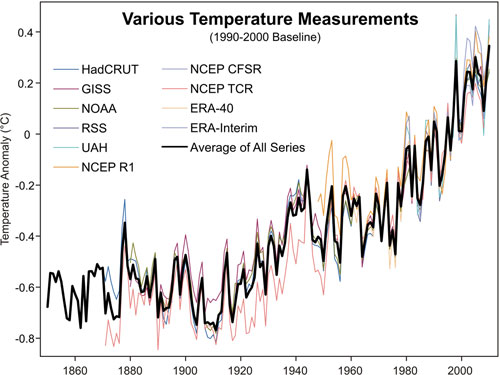
First, contrary to what Zycher argues, the warming signal in the global temperature record is not ambiguous. Ten different temperature estimates (three from surface observations, two from satellites, and five from climate reanalyses) all agree on the big picture of 20th and 21st century warming (c.f. Fig. 1).
Figure 1: The temperature evolution of 10 different global temperature indices. Source: Skeptical Science
Understanding “surge” and “hiatus” events in climate warming is an active part of climate research. For instance, the warming that began in the early 20th century (1925-1944) is consistent with natural variability of the climate system (including a generalized lack of significant volcanic activity, which has a cooling effect), solar forcing, and initial forcing from greenhouse gases. From the 1940s to the 1970s, human-induced aerosol emissions were the dominant forcing factor which led to a slight global (and U.S.) cooling in this period. Aerosols directly affect the climate by scattering and absorbing radiation, and indirectly affect climate by altering cloud radiative properties, duration and amount. Both favor cooling.
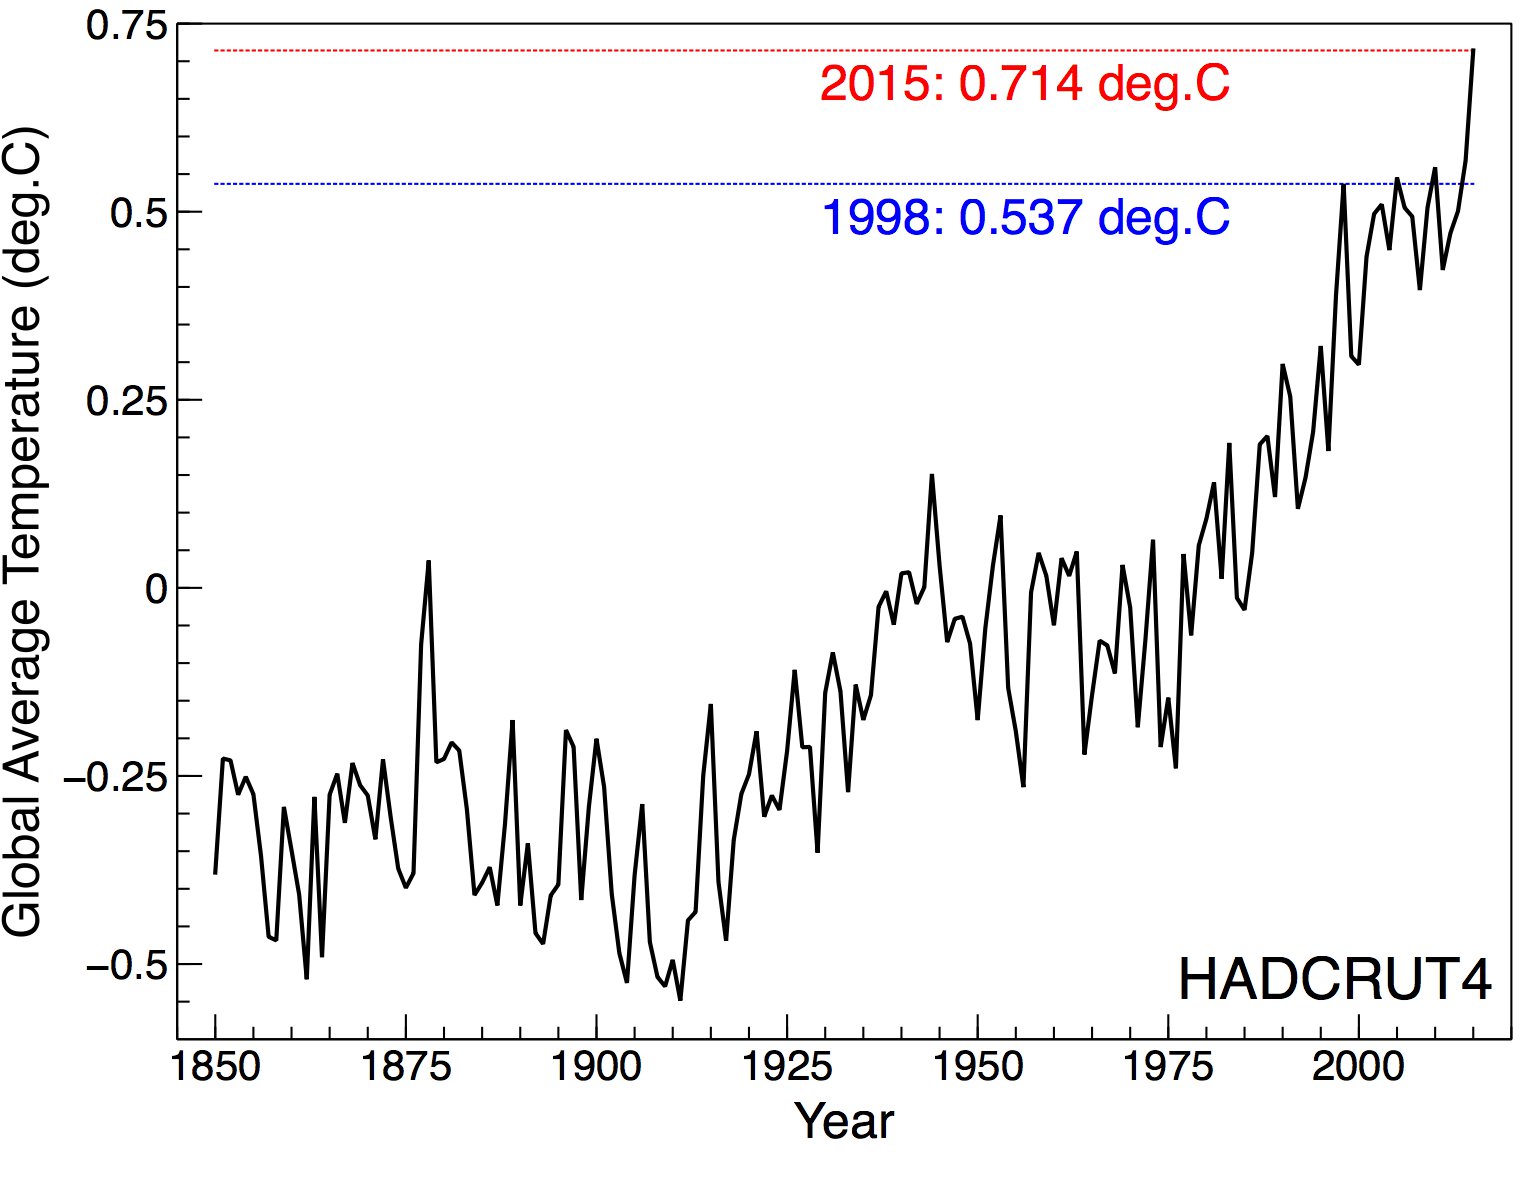
Of course, natural variability matters. For instance, Dr. Zycher correctly notes that 1998 and 2015 were/will be warm years due to the effect of El Niño, but incorrectly surmises that temperatures remained flat between these two time intervals (c.f. Fig. 2). Rather, the warming trend is nearly consistent since 1970.
Figure 2: Surface temperature evolution of the HADCRUT4 dataset, 1850-2015 (2015 uses year-to-date average values and will not change much with the addition of November and December data). The blue and red lines are the temperature values for the years 1998 and 2015, respectively.
How much of the warming signal is attributable to humans?
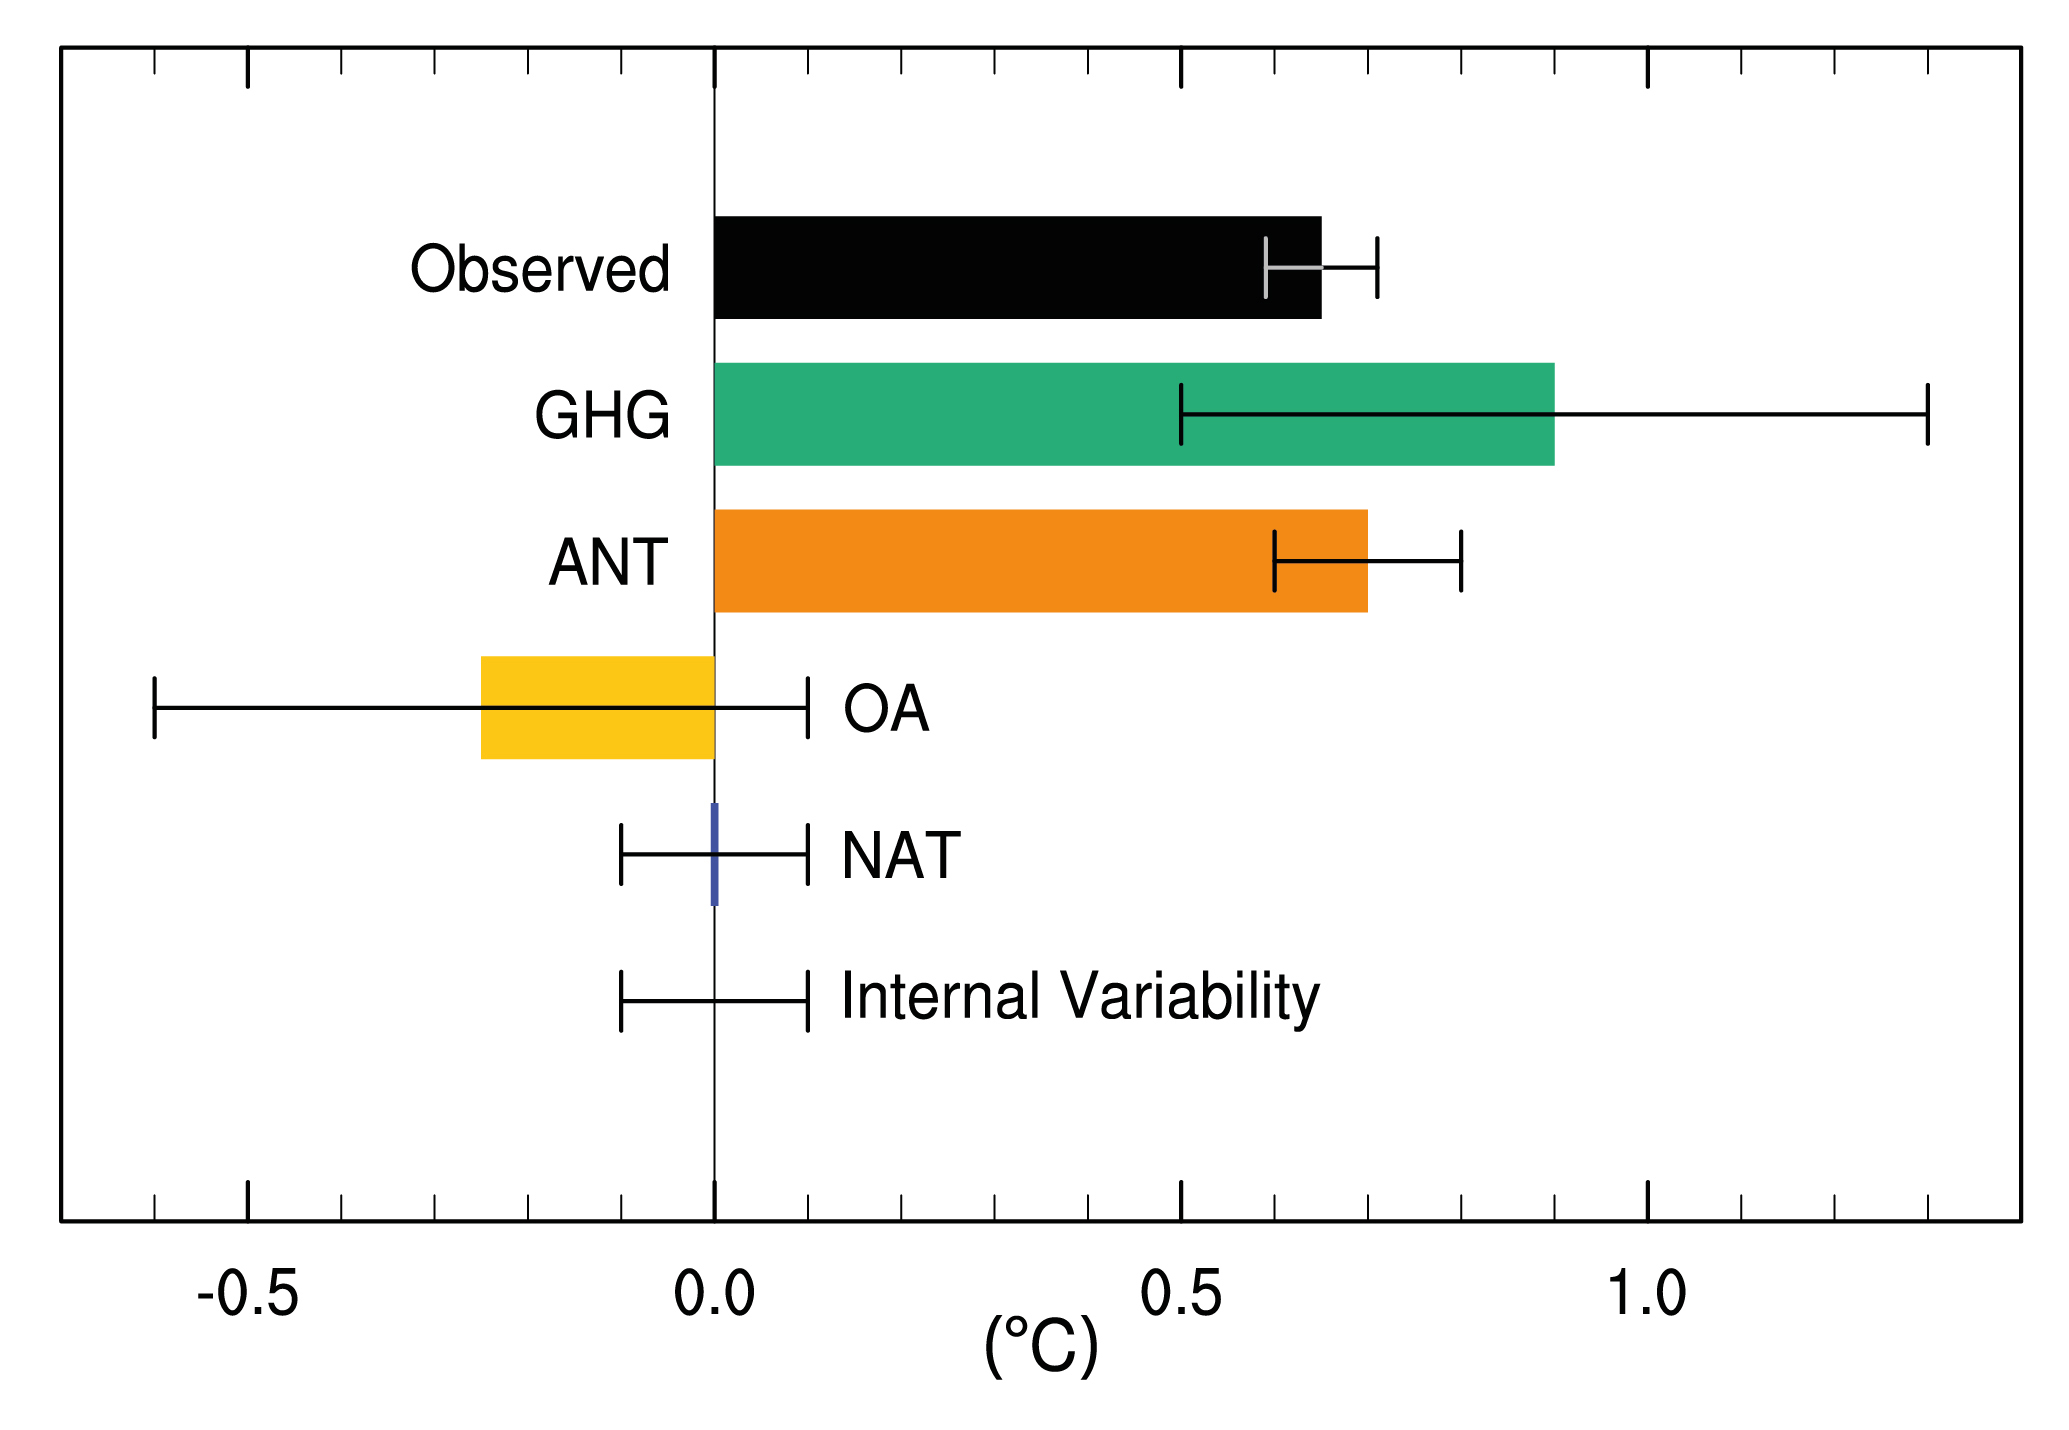
In its 5th Assessment Report, the IPCC looked at the warming from 1951-2010 to identify how much of the observed warming over that period could be confidently attributed to human factors (c.f. figure 3). The observed temperature change is in the region of just under 0.7°C (1.3°F) with errors of ±0.05°C (±0.1°F). The contribution of greenhouse gases is greater than the observed warming, while the total anthropogenic contribution is thought to be around 0.7°C because of the cooling effect of aerosols.
Figure 3: Estimates of natural and human-induced atmospheric temperature change from 1951 – 2010. Black – Observed Warming, Green – greenhouse gases, Orange – total Influence from human factors, Yellow – other human factors, Blue – Natural Factors (volcanos and solar forcing). Source: Figure 10.5.
The point here is that climate scientists cannot account for the observed warming of the last half century with just natural factors and variability alone. The contribution from natural factors and internal variability is thought to be about 0°C with an error range of ±0.1°C (±0.2°F).
These attribution calculations depend on climate models because we cannot measure the impact each forcing agent has on temperature alone. We can only measure the composite impact. Zycher maintains, however, that climate models are suspect. So let’s examine his critique of the models first and then revisit whether or not that critique invalidates the attribution argument discussed here.
Is there a problem with climate models?
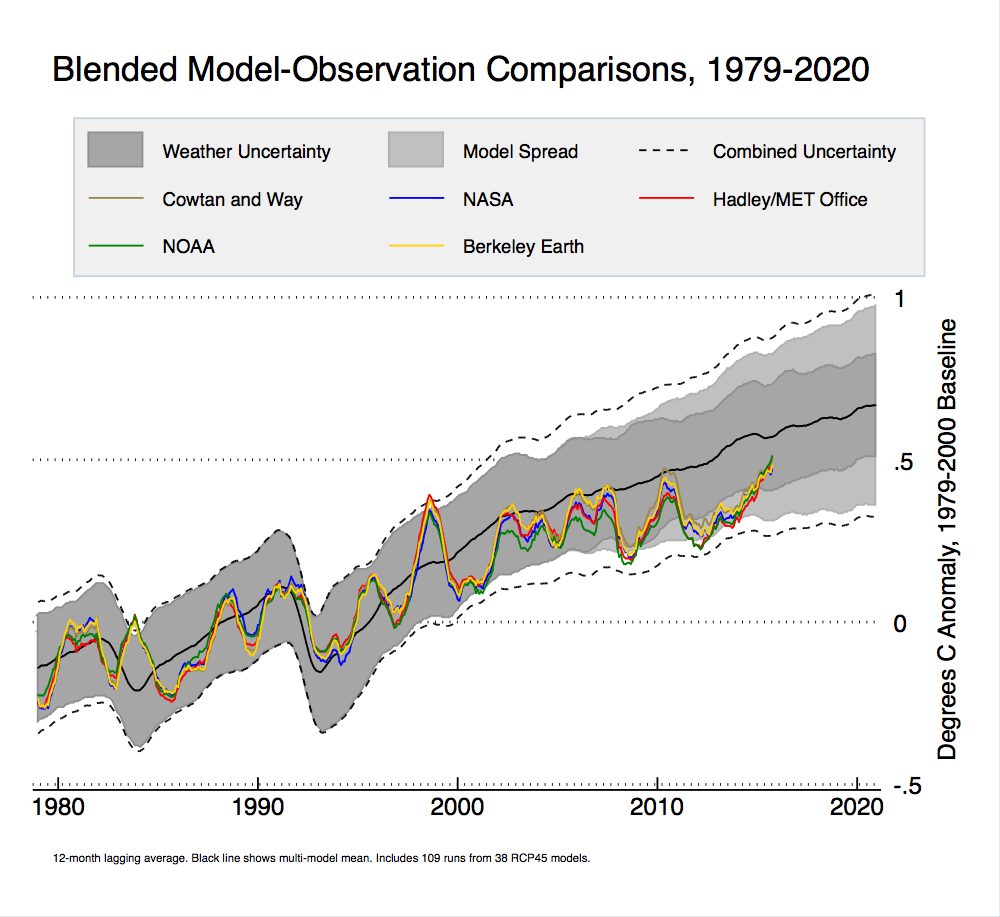
The final part of Zycher’s argument pertains to the divergence between climate models’ predictions of climate change and temperature observations. We discussed in a recent post that adjustments need to be made for an honest comparison. Regardless of whether such adjustments are applied to the climate model output, the observations, using the latest data, fall inside the modeled range when we consider the numerous sources of uncertainty for surface temperature data (c.f. Fig 4).
Figure 4: Climate model to observation comparison using recent analysis from Zeke Hausfather.
Some climate skeptics argue that the model-data divergence in recent warming indicates that climate models are too sensitive to CO2 emissions. We’ve argued, however, that other explanations are possible. The remainder of the misfit in the last decades could well be a symptom of internal variability in the real world not captured by the models. One shouldn’t, after all, expect climate models to capture the exacting timing and magnitude of internal variability on the part of the real climate.
Climate model simulations are not designed to match the timing of the real climate’s internal variability. But Zycher points to excursions from 1910-1940 and 1940-1970 (a warming then a cooling that climate models do not collectively capture) as evidence of their inability to estimate response to forcing over longer periods.
Do either of these criticisms invalidate the attribution of the warming over the last half century? It’s unlikely, because attribution procedures are designed to consider the possibility of model deficiencies and are tested to make sure climate models simulated internal variability well enough for attribution studies.
Climate model predictions, however, are not accepted blindly when making attribution claims. The attribution calculation in the IPCC AR5 is based on fingerprint studies, where the spatial patterns of the temperature response of the climate models to various agents are scaled to best reconstruct the temperature record from observational constraints. If climate sensitivity is too high or low in a particular model, then the response to CO2 is scaled up or down when making the attribution calculation (such scalings are shown here). It is the combination of these scaled fingerprints that inform the final attribution calculations shown in figure 3.
If climate models were poorly simulating the internal variability of the climate (statistically speaking), that would challenge the attribution statement. But climate models would have to underestimate the scale of variability by a factor of at least 3 to account for the observed warming in figure 3. Excurions on the scale of two or three decades (as Zycher invokes) is not such an error. John Niels-Gammon, Texas’s State Climatologist, considered this argument last year and found it unconvincing.
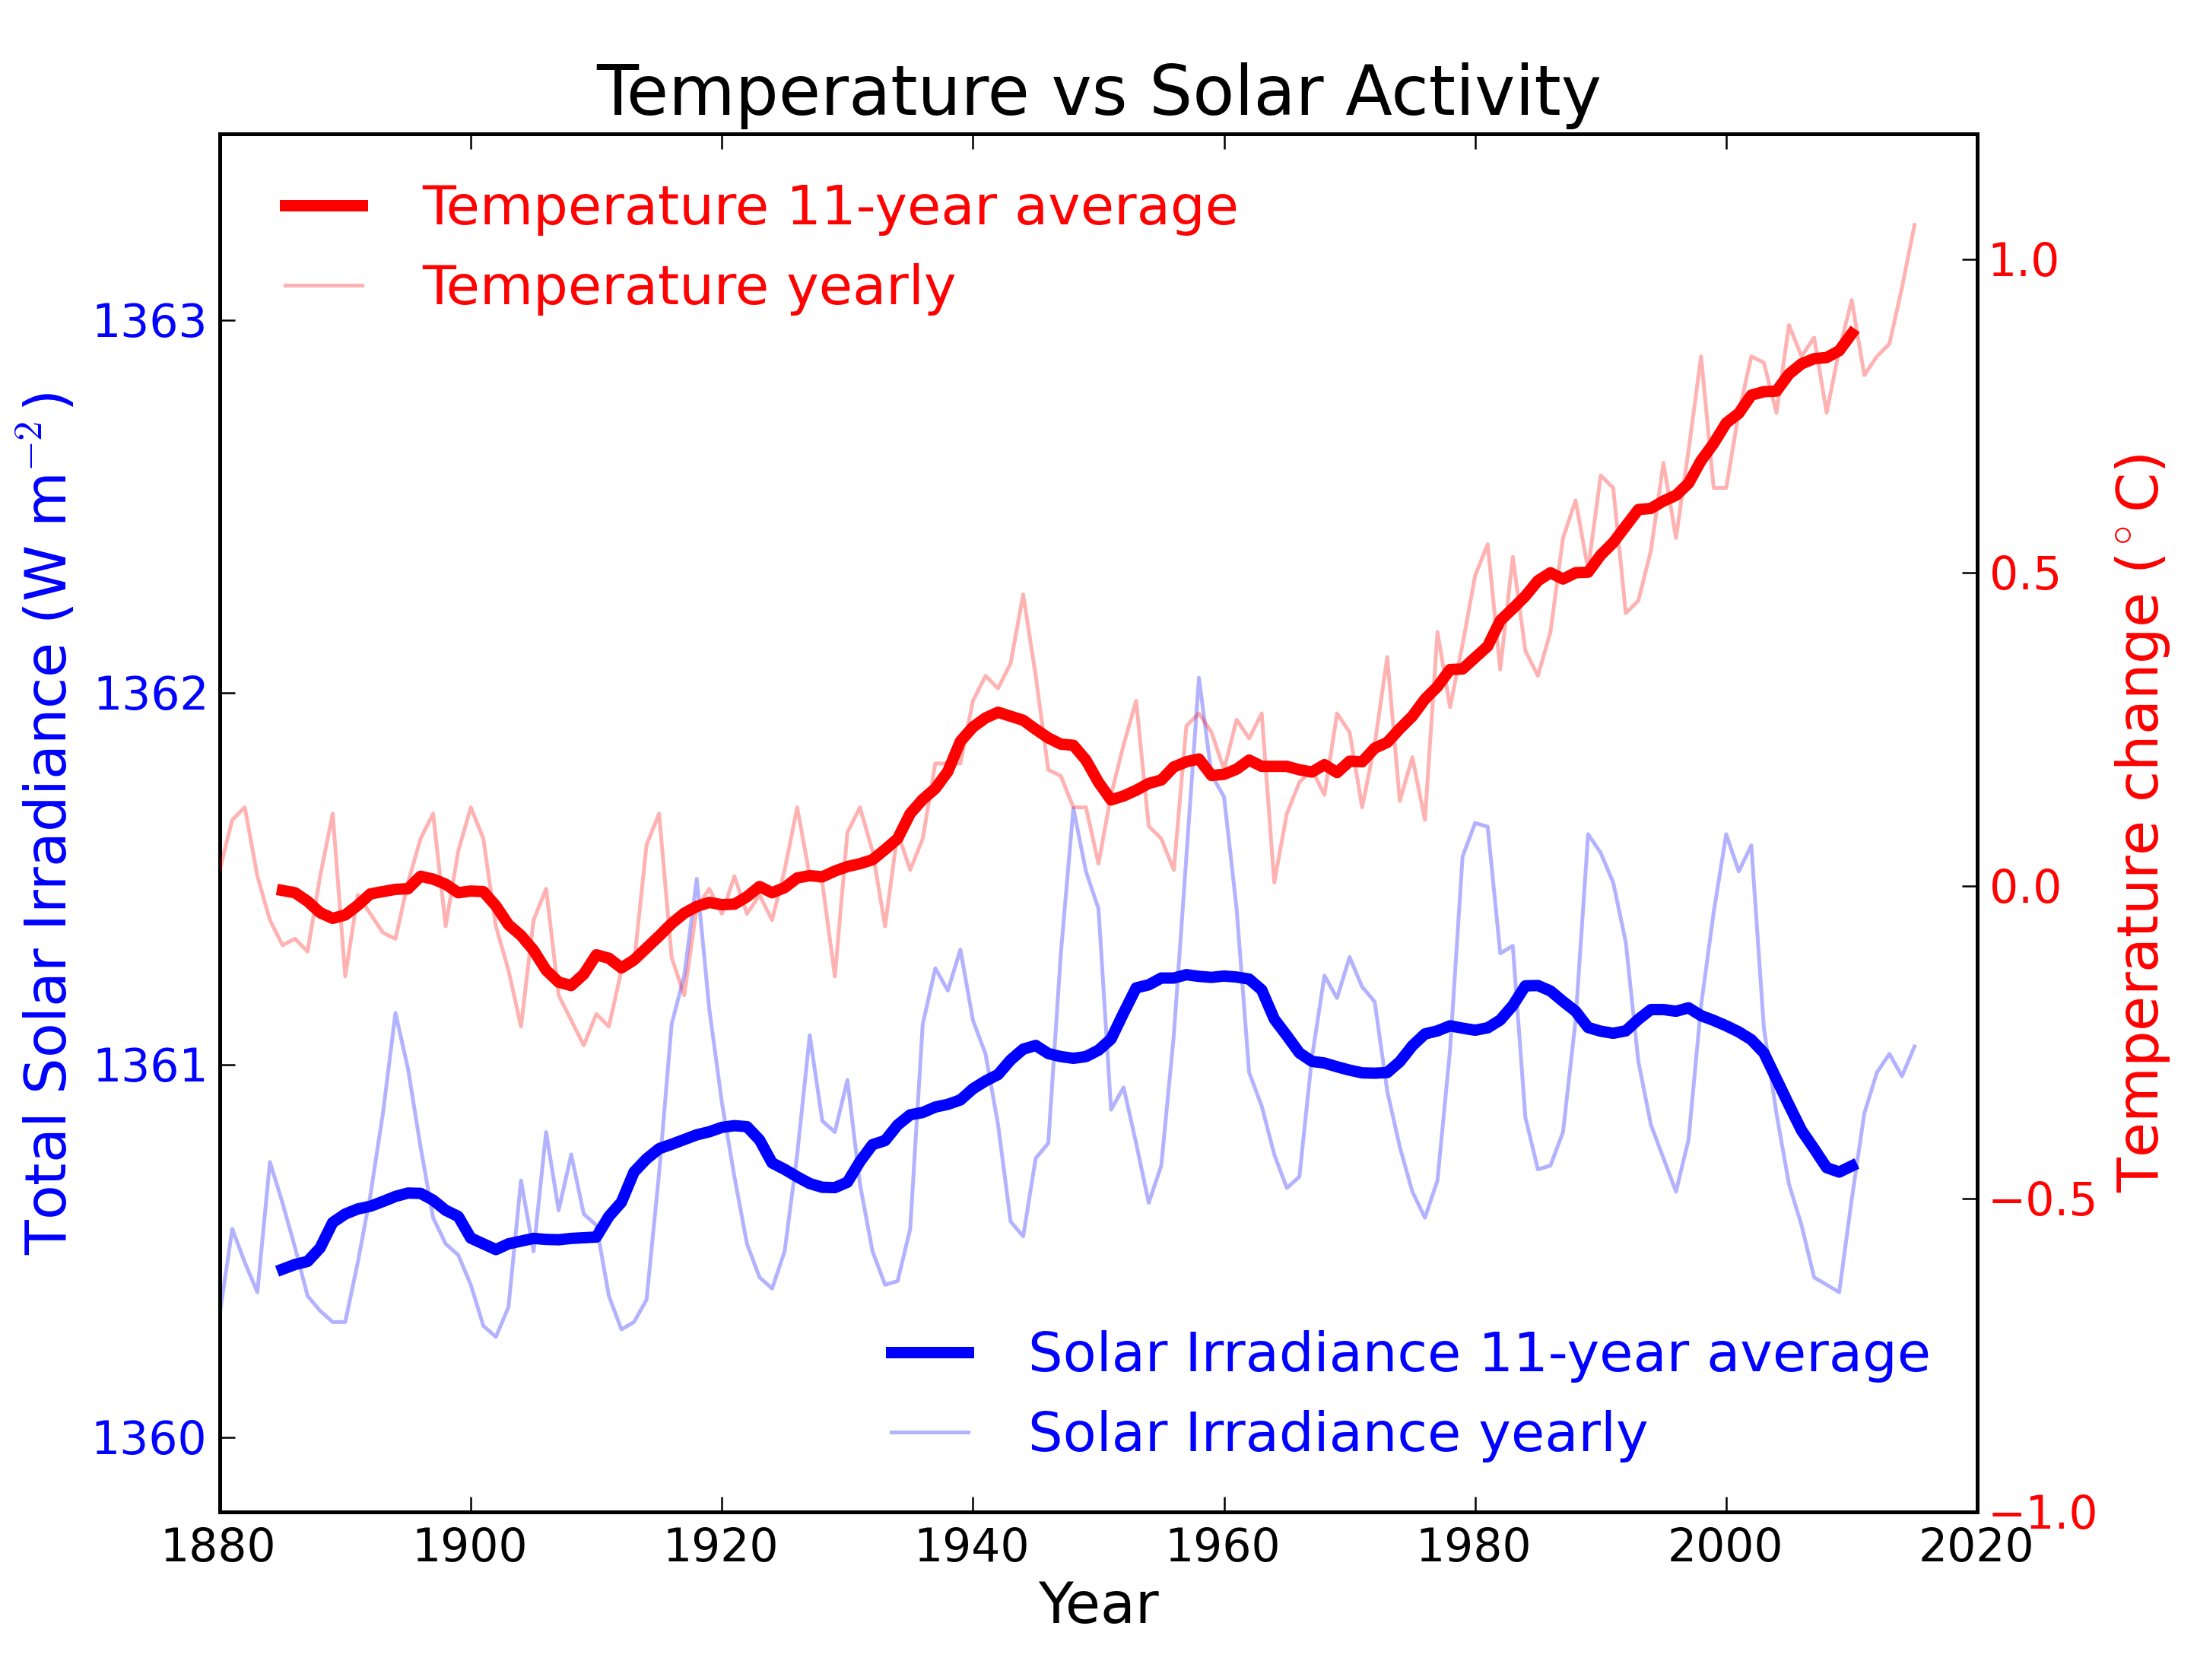
Unconvinced of the human contribution to warming, the alternative that Zycher suggests is that the warming we have observed may be a symptom of our emergence from a little ice age (starting in about 1800). But no physical hypothesis supports that claim. The science tells us that increased solar insolation brought the Earth out of the little ice age, but solar insolation has declined over the last half century—just as human forcing took over. Given the evidence, ambiguity is not apparent.
There is a great deal of uncertainty associated with how the climate will respond to greenhouse gas concentrations in the future. But there is little uncertainty about how it has responded thus far.
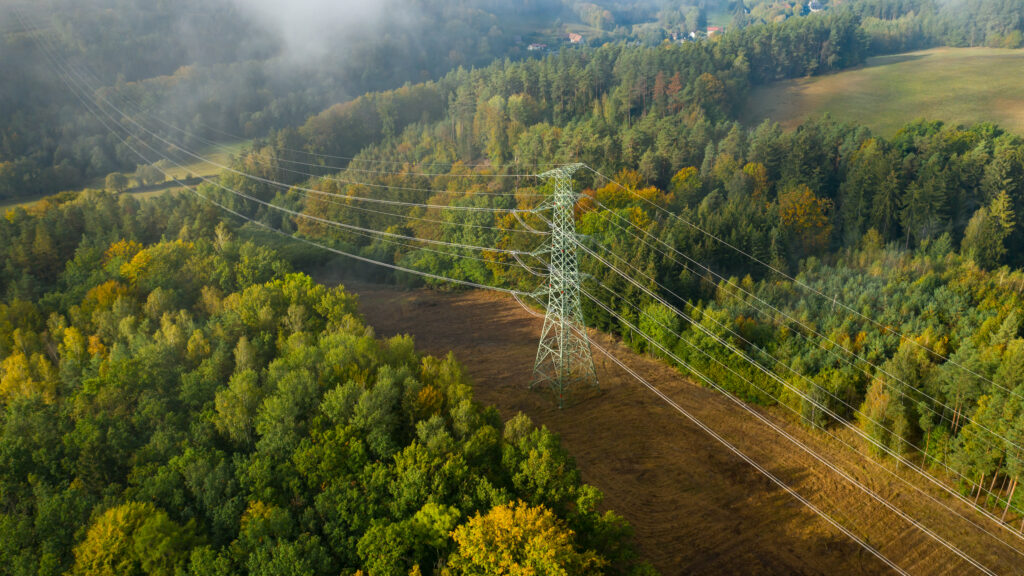
[Banner Image: What’s Really Warming The World, Bloomberg Business]


