
Housing prices have been on a tear over the last five years. The Case-Shiller national composite has risen 35 percent since its post-crash bottom in 2012, and is currently just above its pre-crisis peak, set in the spring of 2006. This has R Street’s Alex Pollock wondering whether the Fed has re-inflated the real estate bubble.
In the wake of the bubble, the Federal Reserve set out to create renewed asset-price inflation. It certainly succeeded with commercial real estate – a sector often at the center of financial booms and busts.
Commercial real estate prices dropped like a rock after 2007, far more than did house prices, falling on average 40 percent to their trough in 2010. Since then, the asset price inflation has been dramatic: up more than 100 percent from the bottom. In inflation-adjusted terms, they are up 83 percent.….
The Federal Reserve also succeeded in promoting asset-price inflation in houses. U.S. average house prices are also back over their bubble peak—by about 2 percent, in this case. They have rebounded 41 percent from their 2012 trough. In inflation-adjusted terms, house prices a have climbed back to the level of 2004, when we were about two-thirds of the way into the bubble.
I don’t necessarily agree with Pollock’s framing, but he does have some sweet looking charts, which I am going to share, and then give my slightly different take on.
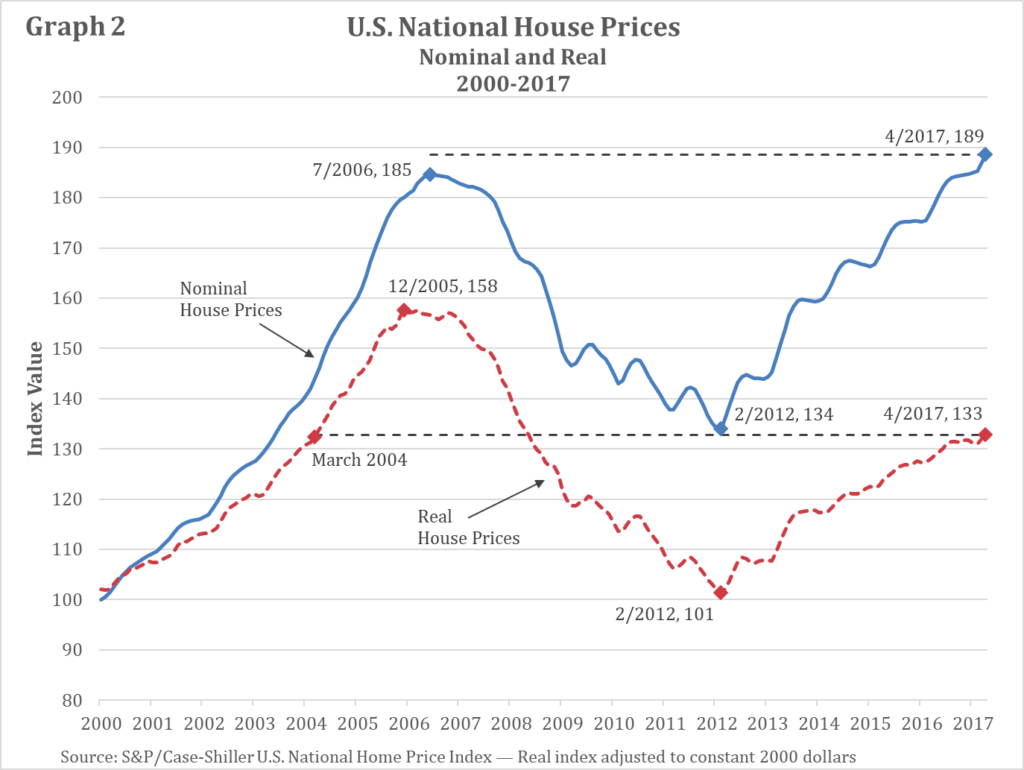
Pollock begins his discussion with commercial real estate but I want to start with residential housing.
What we see here are two different measures of the growth in housing prices. Both measures are indexed to 100 in the year 2000, so the value can be interpreted as the percentage growth since 2000. The red line represents the growth in real housing prices, or prices after they have been adjusted for inflation. The blue line represents the percentage growth in housing price without accounting for inflation. Economists refer to this as nominal housing values.
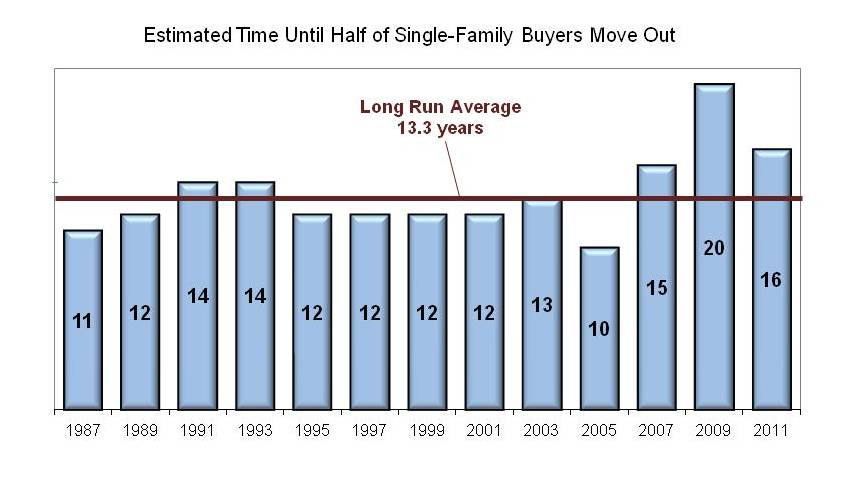
As mentioned, nominal values have rebounded strongly over the past six years, despite a weak economy, increased financial regulation, and a backlog of foreclosures. This rise in nominal values is key because it is tied to the viability of mortgage contracts. Suppose homebuyers in 2007 had gotten caught up in bubble fever, taken on a mortgage that was a bit too much for them to afford, and then watched the value of their investment collapse. Well, if they could have ridden the wave out for 10 years, then they could have gotten back out at least what they put in. Ten years is a long time, and according to the NAHB, it’s a bit less than how long the median homeowner stayed put through the 90s and early 2000s.
Riding the bust out would have been tough, but not wildly out of the ordinary for the average homebuyer. Yet, it only took this long because inflation has been extraordinarily low, rarely rising to two percent a year. A faster rate of inflation would have brought homeowners out of the dip even sooner.
All of this to say that buying at the peak of the housing bubble was not nearly as insane as one might think. If you planned to stay in the house a normal length of time, you wouldn’t have lost any money. Now, you could have done better by waiting if you had known that a housing bust was coming. But not timing a bust is not quite the same thing as buying into a bubble.
Buying into a bubble suggests that you are paying irrationally high prices that are premised only on the notion of “some-greater-fool” coming along and rescuing from your mistake. As we can see that is not the case. Missing the bust simply means that you were not savvy enough to time a fluctuating market. Accepting one’s inability to get in at the just the right time is considered wisdom in stock and bond markets, and with good reason.
There is a conceptual paradox with timing the market by buying when prices are low. If you’re right and this really is the best time to get in, then everyone should be getting in. Yet, if everyone was getting in, then prices would already be rising due to the high demand. Thus, low prices which are attracting you are at the very same time a signal to stay away. Wise investment counselors advise their clients to ignore the ups and downs as much as possible, and buy and sell based on your own needs, not your perception of market trends.
Could the same thing be true of housing?
That is, might it be the case that we have entered a phase where sometimes housing prices will go down? Wise homeowners buy and sell based on their own needs, not in some attempt to judge the market. The market will be buffeted by forces that are nearly impossible for the average homeowner to gauge—forces like international changes in liquidity.
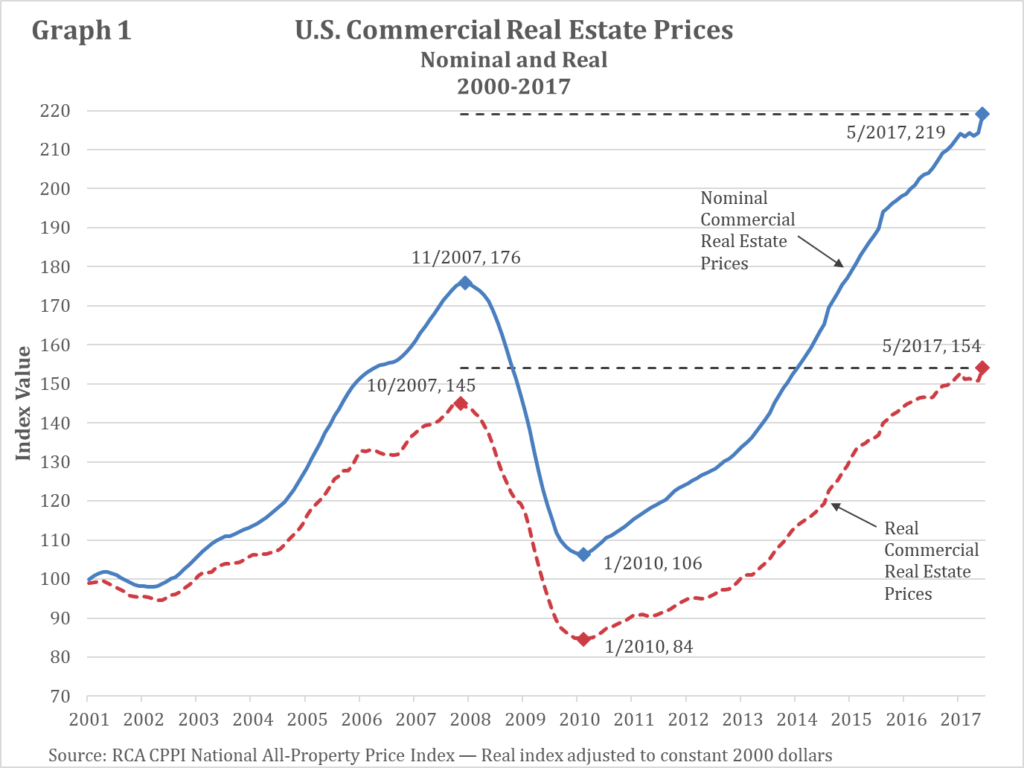
This brings me to Pollock’s second, beautiful chart. Here we have an index of commercial real estate prices over the same time period.
Similar to before, the blue line represents the index of nominal commercial real estate prices. The red line represents the index of real commercial real estate prices. In the commercial real estate market, both the real housing prices have recovered. That is, someone who bought commercial real estate at the height of the bubble and held it until now would be ahead in real terms on their investment.
Nominal prices meanwhile have soared past their peak. Indeed, while there was a steep drop during the recession, their climb back out has been just as aggressive since 2010 as it was in the years leading up to the financial crisis.
What makes for the difference? Pollock points us in the right direction.
Notably, bank credit to commercial real estate has been expanding. It is up $238 billion, or 21 percent, since the end of 2013 to $1.35 trillion. It has grown in the last two years at more than 7 percent a year, which is twice the growth rate of nominal gross domestic product, although not up to the annual loan growth rate of more than nine percent in the bubble years of 2000-2007.
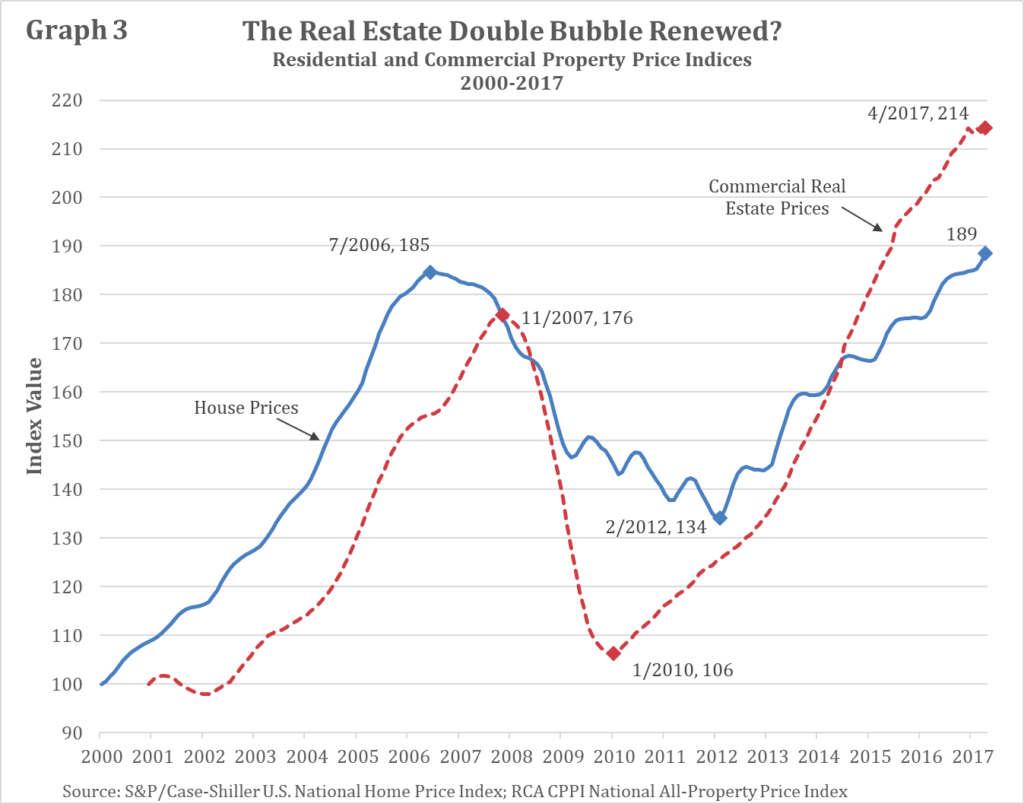
Now, I am not quite so sure that there was a bubble. The key point, on which Pollock and I agree, however, is that credit to commercial real estate investors has been expanding nearly as fast today as in the days before the crisis. Credit to housing, as we mentioned before, has been constrained. This has lead to to very divergent paths, as shown in Pollock’s third graph.
Here, the blue line represents our measurement of nominal housing price growth, while the red represents our measure of nominal commercial real estate price growth.
Commercial real estate started to boom later than housing, but much harder during the recession. This makes sense. Businesses cut back much more aggressively on investment than households do on housing. Yet, commercial real estate—with the aid of aggressive bank credit—has more than made up for the ground that it is lost.
Let me then tie all this together by advancing a theory: there was no bubble in either housing or commercial real estate. There was, however, a massive increase in liquidity driven by financial innovation in the late 1990s and early 2000s. That increase in liquidity allowed real estate markets to behave more like stock or commodity markets. In good time, prices would rise rapidly as money poured into capital markets. During recessions, prices would retreat as money retreated to safer havens.
That pattern was evident in both housing and commercial real estate prices up until about 2009. Efforts by the government to arrest home foreclosures as well as to reform capital market drained liquidity from the housing market. The fall was ameliorated but so was the recovery. In the end, homebuyers who held onto their properties had to wait longer than commercial real estate investors to see their values return to peak levels. Yet, return they have, because the ultimate driver in both cases was the demand for scarce urban land. Liquid markets allow that demand to act faster on prices, but the fundamental driver isn’t irrational bubble behavior. It is competition over a scarce resource.
If I am right, then we should continue to see both prices rise faster than inflation over the long term. There may be ups and downs, especially in the more liquid commercial real estate space. However, until land use reforms or some hitherto unknown technologies reduce the underlying demand, the secular trend will be upward.
—
Karl Smith is the Director of Economic Research at the Niskanen Center


