
This post comprises part two of the Niskanen Center’s response to an article published by Dr. Benjamin Zycher of the American Enterprise Institute, an article that forwards a number of arguments commonly marshaled by climate skeptics. In part 1, Is the temperature record ambiguous, we showed that the temperature record is consistent with the mainstream understanding of natural and human influences on the climate, including CO2’s role as the principal agent of recent change.
Today, we’ll look at the question of whether or not we are seeing evidence of climate change in another part of the climate system. In his article, Zycher claims the following:
- The record on sea-level increases is ambiguous.
- The Arctic and Antarctic ice covers do not differ by statistically significant amounts from their respective 1981-2010 averages.
We will look at each in turn, asking the question, are we seeing what climate scientists would have predicted?
Sea-level increases
Increases in global mean sea level are a predictable impact of global warming. Zycher is correct that the rate of sea-level rise over the past decade was about 1.3 inches per decade. Extrapolating that trend over the next century gives a little less than a foot of additional sea level rise. But … scientists expect an increasing rate of sea level in the future. This will lead to 1 to 3 feet of additional sea level rise by the end of the century (that range depends on physics and future CO2 emissions).
How does the present rate of sea level rise compare historically?
Zycher cites a study of historical tidal gauge data which suggests that sea level rise was greater during the first half of the 20th century than the second half. The study, however, was an unpublished poster presentation which presented an analysis of data from only nine stations combined into a global average.
What do we see in the peer-reviewed literature? This global sea level construction, which uses as many as 71 gauges as far back as the 1900s (as opposed to nine), shows that global sea level rise accelerated over the last century.
The two principle drivers of contemporary sea level rise are the thermal expansion of sea water due to an increased oceanic heat content and addition of mass to the oceans by melting glaciers and ice sheets. Both increasing global oceanic heat content and the “global glacier recession’” are indicators of a warming climate.
Zycher correctly identifies the short-term influence of the El Niño Southern Oscillation (ENSO) on global sea levels. But ENSO is not driving the long term trend or recent acceleration of sea level rise. The driver is long-term climate change.
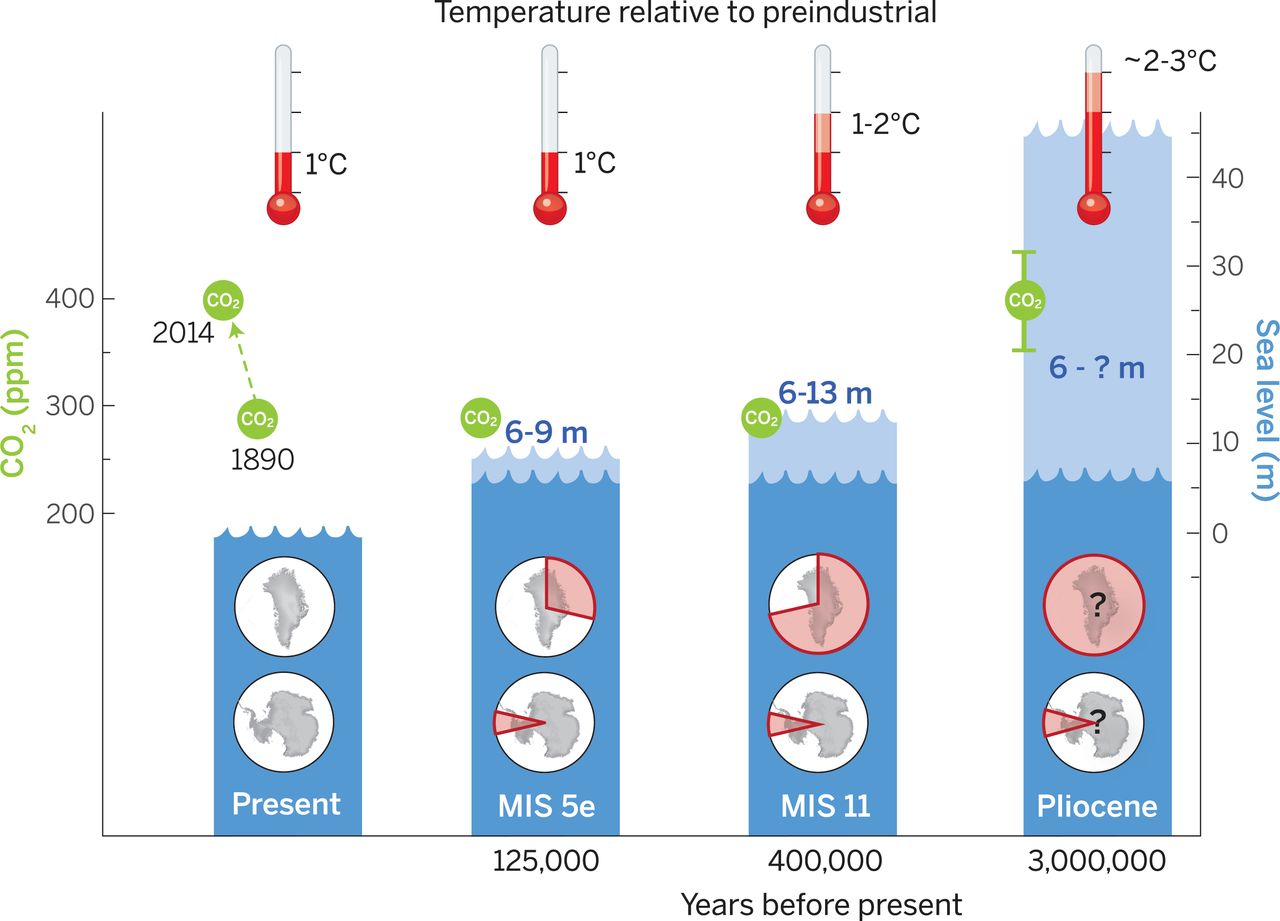
Analysis of climate changes deep in earth history indicates that a peak global mean temperature of 1 °C or more above preindustrial times (which we have recently reached) is associated with a corresponding global sea level increase of almost 20 feet (6 meters, c.f. Figure 1). This isn’t to say that 20 feet of sea level rise is expected any time soon. Those increases will take time (maybe millennia) to play out. But coastal cities will certainly be adapting to rising sea levels throughout the 21st century and beyond.
Figure 1: Comparison of the peak global mean temperature, atmospheric CO2, maximum global mean sea level, and source(s) of meltwater past changes in sea level. Source: Dutton et al. (2015).
Sea Ice
The melting of polar ice is another hallmark of global warming. Zycher argues that polar sea ice cover hasn’t changed much (sea ice floats on ocean water and is distinct from the ice sheets that rest on Greenland and Antarctica). He asserts that the Arctic and Antarctic sea ice extent in November 2015 was within the 1981-2010 average spread of observations.
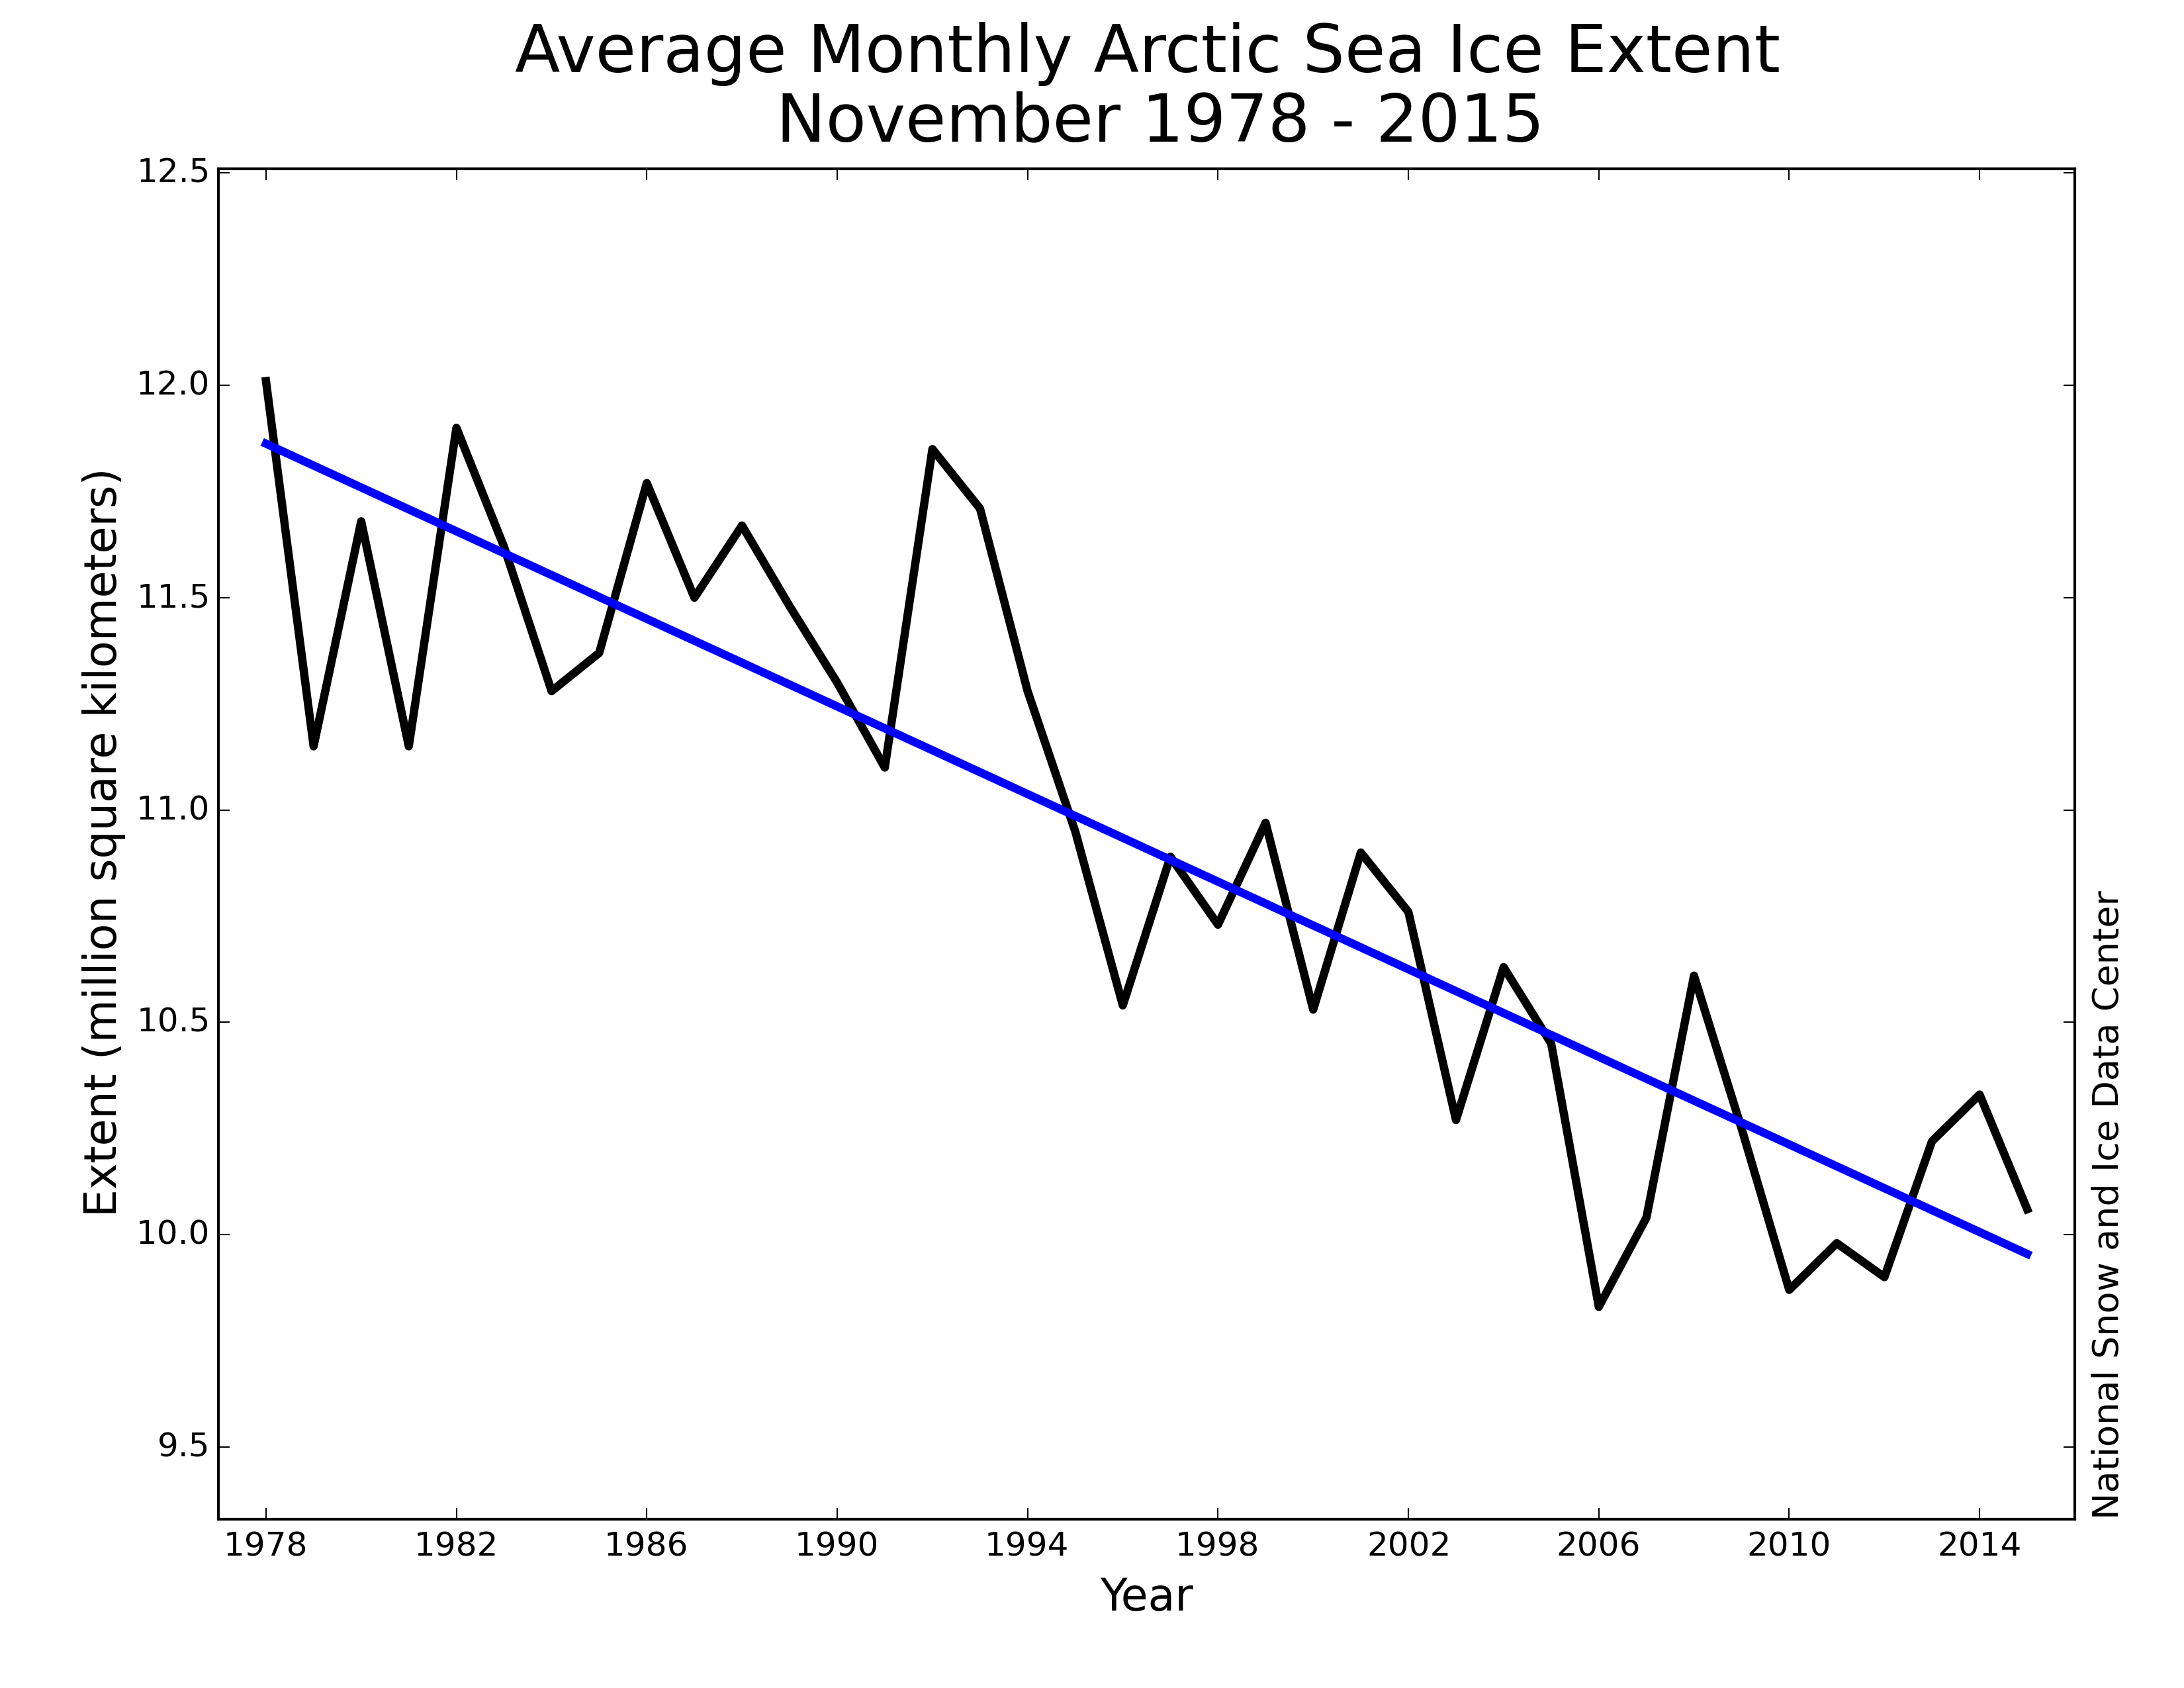
This is an odd statistic to invoke because, if we examine the November extent of Arctic sea ice in the graphic below (c.f. Figure 2), it is hard to argue that there is no long-term negative trend in the data.
Figure 2: November sea ice extent, 1979-2015. Source: NSIDC.
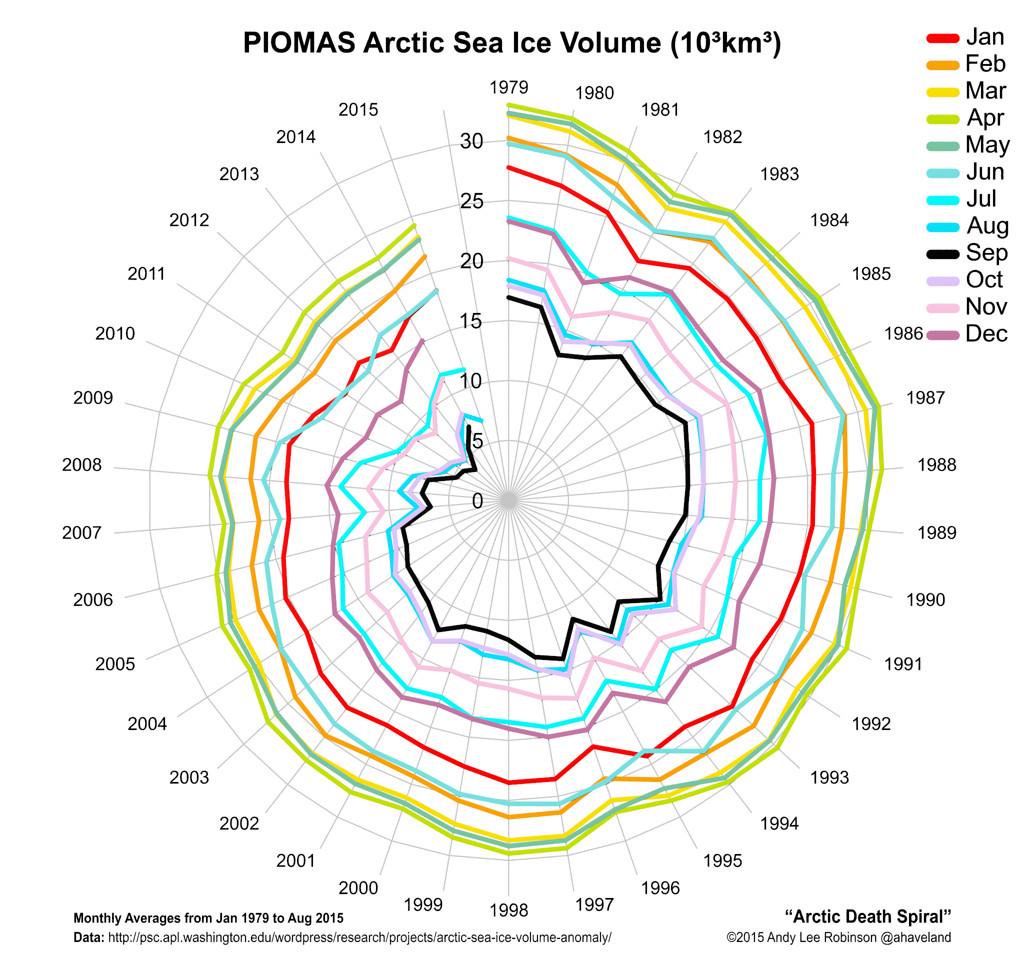
A focus on November is unusual, given that the transitional seasons (i.e. fall growth in the Arctic, spring decline in the Antarctic) are exactly that – transitional. The minimum (summer) and maximal (winter) seasonal extent are generally analyzed. But it matters little, because in the Arctic sea ice has been precipitous across all months (c.f. Figure 3).
Figure 3: Monthly Arctic sea ice volume from 1979 to 2015. Source: Andy Lee Robinson.
The clockwise progression of time in figure 3 shows that the extent of Arctic sea ice has declined in each month of the year, with the amount bounded by the summer minimum (black) and winter maximum (green).
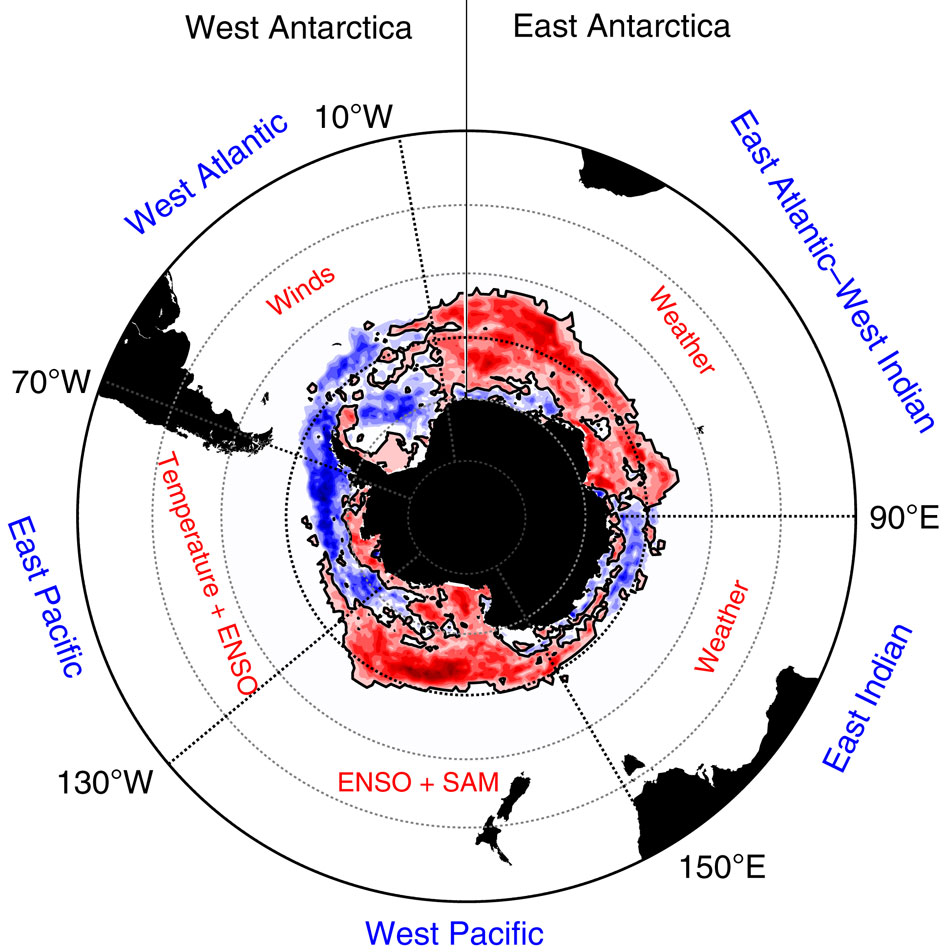
In the Antarctic, maximum sea ice extent has increased since 1979, when the satellite record begins, with 2014 the year with the largest ice extent on record. Sea ice trends around Antarctica are heterogeneous, with different climatological factors at play. Figure 4 shows proposed drivers in sea ice duration trends from 1990-2007.
Figure 4: Trends in sea-ice duration, 1990-2007. Red/Blue = an increase/decrease. Image Source: Matear et al. (2015)
Unlike the Arctic, where a clear global warming signal is evident, Antarctic sea ice has not shown a homogeneous response to global warming. That is not necessarily a surprise when one digs into the literature on this topic. You can’t get polar regions more physically distinct than the Arctic (sea ice covers ocean) and the Antarctic (ice covering a continental land mass). But in terms of total mass, Arctic losses have far outpaced gains in the Antarctic. This has resulted in a global decline in sea ice.
There are many puzzles and uncertainties still to be resolved in climate science. But the evidence that the climate is changing is unequivocal. Global temperature shows it. Our physical understanding tells us with a high degree of confidence that human activity drives much of the change we are seeing. And it plays out in what else we’ve seen and climate change theory predicts:
- Sea level rise that accelerated over the last century, driven by glacial melt and ocean heating. The expectation is that this will continue.
- A downward trend in sea ice cover in the Arctic that drives a global decrease in sea ice, despite gains (for now) in Antarctic sea ice cover.


