The COVID-19 pandemic is having a disproportionate impact on the health of low-income Americans, but even those low-wage workers who avoid the disease itself are likely to suffer grave economic distress.
In part, that is because workers with lower incomes have been more likely to lose their jobs than those who are better paid. The Pew Research Center reports that 32 percent of upper-income adults say that someone in their family has lost a job or taken a pay cut due to the outbreak. That compares with 42 percent of middle-income households who report lost jobs or pay cuts, and 52 percent of low-income households.
But pay is only part of the story. To fully understand the disparate economic impact of the pandemic, we need to look also at household wealth, or more exactly, net worth. The margin by which assets exceed household liabilities is crucial to a household’s ability to weather a job loss or a pay cut without catastrophic effects. And household net worth is not only less equally distributed than income — it is also frighteningly fragile for those in the bottom half of the population. That fragility is a major threat to hopes for a speedy economic recovery, as we will see.
Prosperity at the top, fragility at the bottom
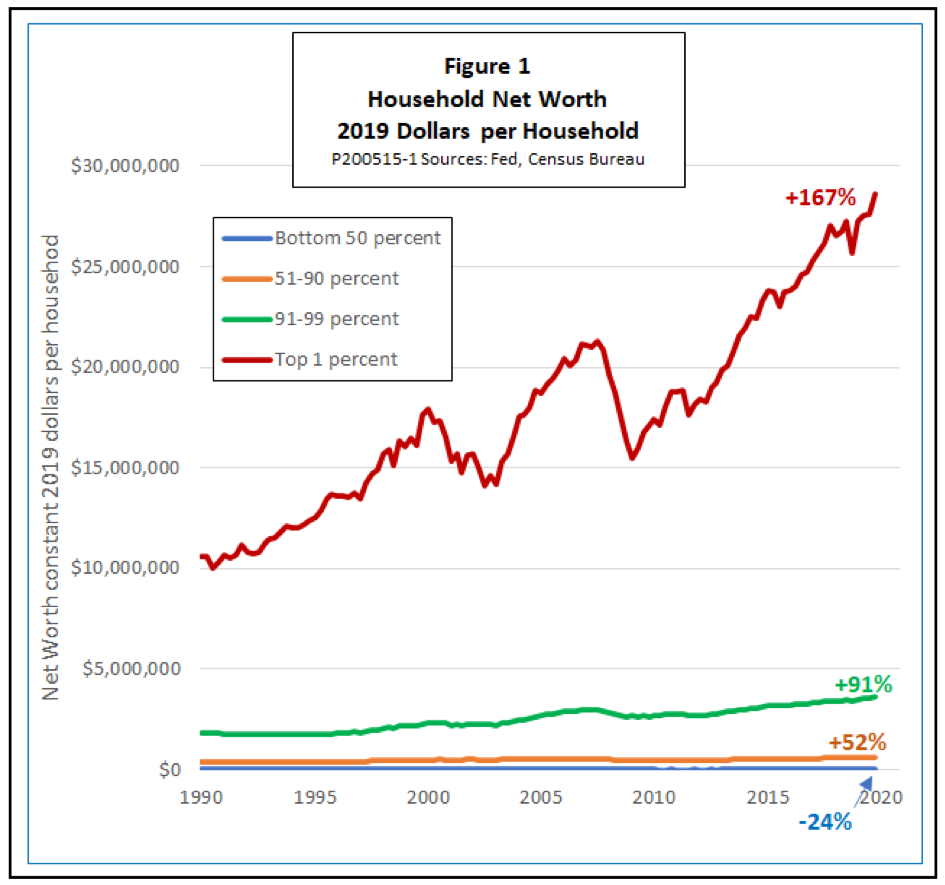
Let’s look at some data. Figure 1 shows trends in the net worth of U.S. households from 1990 to the end of 2019, as reported by the Federal Reserve. All numbers are adjusted for inflation using the consumer price index.

We see from the top line in Figure 1 that the top 1 percent of U.S. households have done very well, increasing their net worth by 167 percent over the past three decades. Those with middle incomes (51st to 90th percentile) and upper-middle incomes (91st to 99th percentile) have not done badly, increasing their wealth by 52 and 91 percent, respectively. But those in the bottom half of the population have not done well at all. Their average real net worth has actually fallen by 24 percent since 1990. And keep in mind, we are not talking just about the 12 percent or so of the population who are officially poor. We are talking about the entire bottom half of the population.
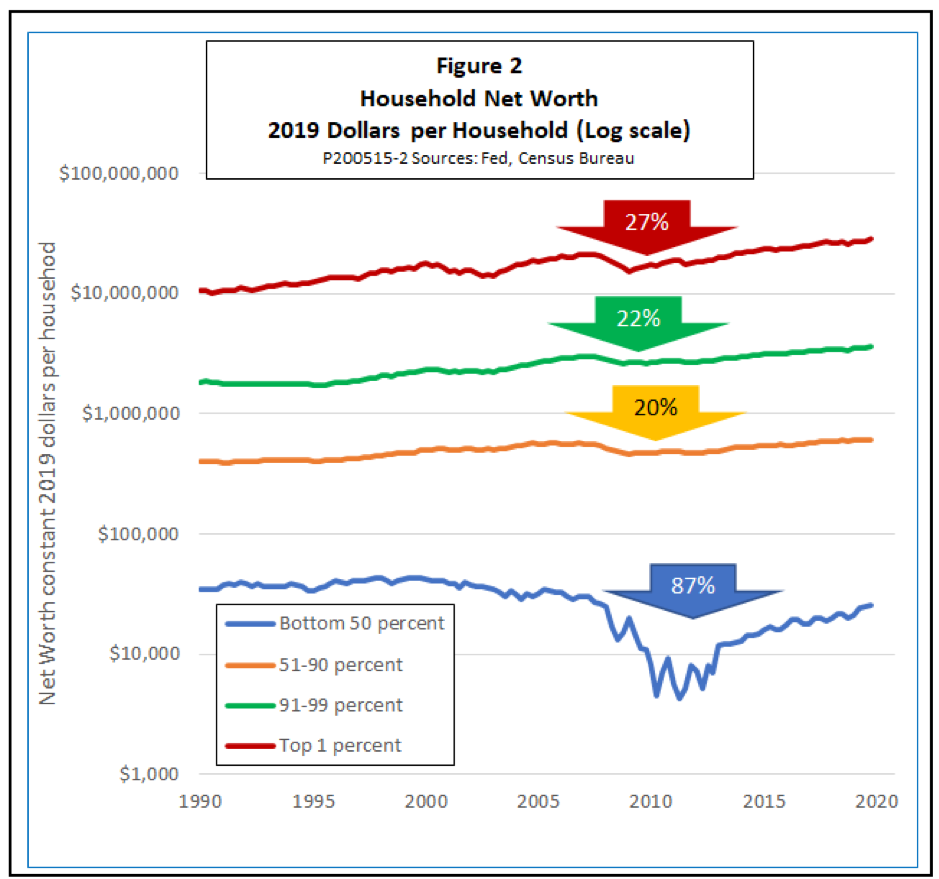
In fact, you can’t really see what is going on with that group from Figure 1, since the blue line representing low-wealth households lies right flat along the horizontal axis. There’s an easy way to fix that. Figure 2 shows the same data replotted on a logarithmic scale to show more detail on changes in the net worth of the bottom 50 percent.

Consider, in particular, the effects of the downturn of 2008-2009 — a downturn popularly known as the “Great Recession,” although it may soon lose that title, since the one we are entering now is likely to be greater still. In the last recession, the top 1 percent lost 27 percent of their real wealth, as measured from the best quarter before the crisis to the worst one during it. Since that time, they have recovered all of their losses and then some. The middle and upper-middle groups lost about 20 percent of their wealth in the recession, and they, too, had more than regained their losses by the end of 2019. In contrast, households in the bottom half were hit much harder, losing 87 percent of their net worth. What is more, by late 2019, they were still more than 20 percent short of their position before the recession began.
Should we conclude that the rich picked their assets well while the less-well-off made bad investments? Not really. For the most part, the difference between the wealthy and the rest lay not in the quality of their assets but in the size of their debts.
It’s all a matter of leverage
In financial circles, the relationship of a firm’s or household’s debts to other items on its balance sheet is known as leverage. If you owe a lot relative to what you own, you are said to be highly leveraged. If your debts are relatively modest, your leverage is said to be low. Leverage can be measured in several ways, but however it is done, the greater your leverage, the greater the fragility of your financial position if the value of your assets fall or that of your debts increases.
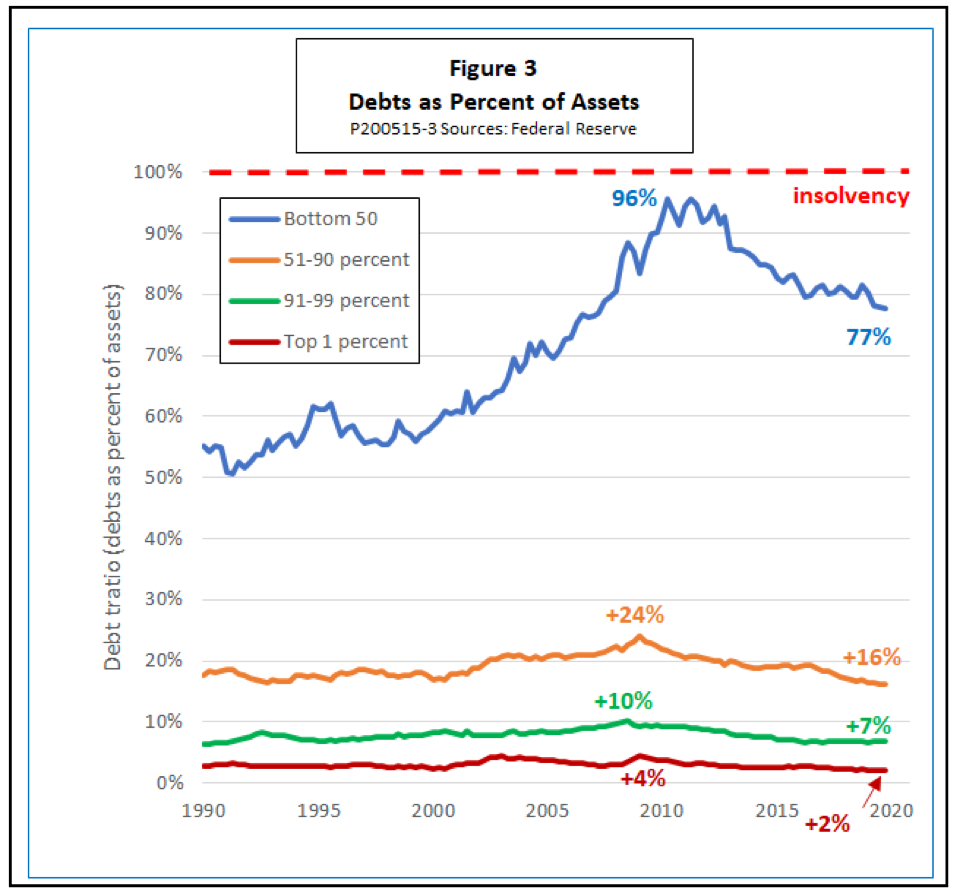
According to Monica Prasad, consumers tend to be more leveraged in countries that have relatively weak social safety nets and easy access to consumer credit. Figure 3 shows that is true for the United States, at least for those in the bottom half of the wealth distribution.

As we see, American households in the middle, upper-middle, and wealthiest groups have consistently maintained moderate leverage. However, in the bottom half have long been more highly leveraged, and increasingly so over time.
Although the assets of middle- and upper-wealth households decreased in value during the last recession, their debt ratios remained well under control. Not so for the bottom 50 percent. As the value of their assets fell, their debt ratio, which was high to begin with, moved perilously close to the red line of insolvency. In the worst quarter of the Great Recession, the average debt ratio for the bottom half was 96 percent. Although the Fed’s data don’t allow us to calculate the number exactly, it is clear that a large fraction of the bottom half of the population were technically insolvent at the bottom of the last recession.
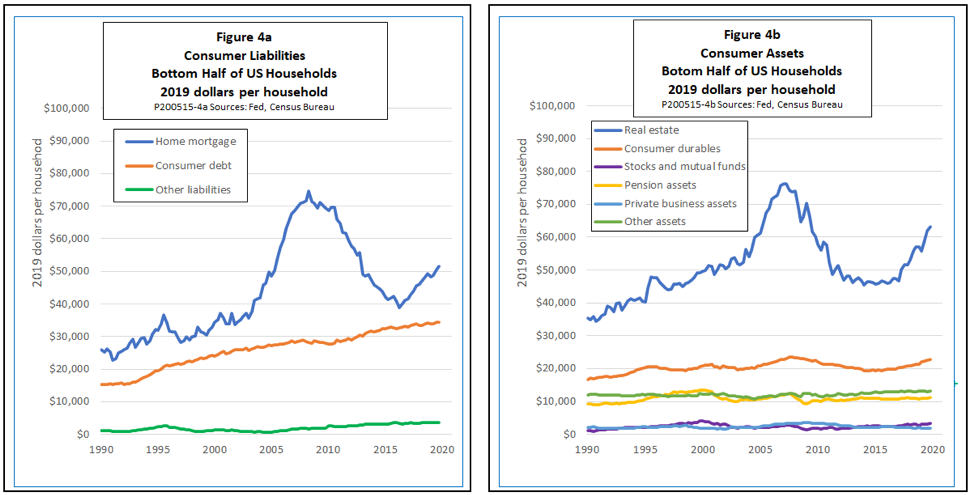
To understand what is likely to happen during the recession that we are entering now, we should start with the fact that employment and output are dropping much more sharply this time than they did in 2008. What is more, the pattern of household assets and liabilities has changed, as shown in Figure 4.

The focus of the 2008 recession was the housing market. The big drop in the net worth of the bottom 50 percent, and the run-up in their debt ratios, was largely due to a decrease in home equity, to the point that it left many homeowners completely under water. After 2015, the value of housing increased, and mortgage debt rose also as households borrowed more against their increasingly valuable homes. However, neither real estate assets nor mortgage debt returned to their prerecession peaks. Going into the COVID pandemic, total mortgage debt owed by the bottom half was about 81 percent of their total real estate assets, leaving a reasonable cushion of equity.
Meanwhile, though, the recovery of household net worth has been undermined by a 25 percent increase in real consumer debt per household over the past decade. Such debt, which includes car loans, credit card balances, and student debt, constituted just 28 percent of all household debt in 2010. By the end of 2019, that had grown to 38 percent.
As the unemployment rate rises toward 20 percent and beyond, both household assets and liabilities will undergo further changes. On the asset side, it is likely that home prices will fall, although probably not by as much as during the last recession. Low mortgage rates will help sustain demand for homes and ease the pain for people with adjustable-rate mortgages. Also, most lenders are offering at least some degree of forbearance on missed mortgage payments, and there has been a moratorium on foreclosures for most mortgages. Those actions should reduce the number of forced home sales.
Meanwhile, unemployed workers will be forced to run down their liquid savings (part of “other assets” in Figure 4b). Some may take advantage of a temporary reduction in penalties and make early withdrawals from pension plans. As of 2019, pension plans and other assets accounted for 20 percent of all household assets for those in the bottom 50 percent. People who are really pinched may resort to selling consumer durables such as furniture, boats, or sports equipment to make ends meet.
On the liabilities side, one of the first things people will do is max out their credit cards (part of “consumer debt” in Figure 4a). Many will take advantage of forbearance on mortgage payments and deferrals of rents, but although those will help their cash flows, they do not constitute debt forgiveness; the missed payments will still represent liabilities. Homeowners with federally insured mortgages are being allowed to let missed payments ride until they sell their homes or until their mortgages are paid off, but some private lenders are insisting that missed payments will have to be paid in a lump sum after only a few months. Much the same is true of student loans and car loans — the first- and second-fastest growing categories of consumer debt. Even if lenders agree to a delay in payments, the result will be a greater burden of liabilities.
Taking the impacts on assets and liabilities together, and considering that the peak unemployment rate in the COVID crisis is likely to reach twice the peak of 10 percent reached in October 2009, it is entirely possible that the average debt ratio for the entire bottom half of American households will exceed 100 percent before the economy fully recovers.
Implications for the recovery
The COVID recession has had an unusually strong supply-side component. Output has been constrained by disruptions in global supply chains; by workers too ill or too fearful to report to their jobs; and most of all, by widespread stay-at-home orders. (See “The Coronavirus and the Economy” for details.)
In recent weeks, much of the controversy over reopening the economy has focused on the supply side. Optimists hope that once stay-at-home orders are eased, the economy will bounce back quickly. As White House economic adviser Kevin Hassett put it, commenting on a mid-May uptick in the stock market, “I’ve been really positively impressed by how quickly things are turning around.”
But the downturn also has an important demand-side component. Consumers have cut back sharply on their spending, not only because stores have been shuttered and restaurants closed, but also because their incomes have suffered. The optimists seem to assume that once regular paychecks are restored, consumers will go back to their free-spending ways. Skeptics have cast doubt on that, noting that many people will be fearful of riding on airplanes or sitting in restaurants while the virus is still circulating. Fear is certainly a concern, but it is not the whole story. A look at the balance sheets of households in the lower 50 percent suggests that it will be some time before even the most fearless of them are willing and able to spend freely.
Even when income starts coming in again, those households are going to place a higher priority on paying down debts and rebuilding savings than on discretionary spending. With maxed-out credit cards, they are going to be less tempted to drop in for a $5.25 venti salted caramel mocha latte on their way to the office, even if the office is open. They are going to think twice about a new car when the old one is still running well, and when there are missed payments to make up on the loan or lease. They are going to trailer their boat to the local lake for some fishing rather than rebook the cruise on which they luckily managed to get a refund when it was cancelled due to the virus.
The result could be that stores and factories optimistically reopen, only to be forced into a new round of layoffs when customers fail to show up. If so, the result could be a W-shaped recovery, even if there is no second round of COVID cases as social distancing eases. A slow recovery is all too real a real risk for an economy in which half the population lives on the brink of insolvency even when times are good.