Since October 2020, U.S. Customs and Border Protection (CBP) has encountered 169,000 Indian migrants at the southern and northern U.S. land borders. Although this number is smaller than that of many groups from Latin America and the Caribbean, Indian nationals represent the largest group of extra-hemispheric migrants encountered by CBP in the past four years.
Several factors may be contributing to this migration, much of which seems to originate from the predominantly Sikh state of Punjab. Politically, there has been a rise in tensions around a Sikh separatist movement known as Khalistan. Despite limited support for this movement, some Sikh migrants report fearing that an increasingly sectarian environment could make them vulnerable to being unfairly targeted by authorities or politicians in India. For others, these tensions provide a credible basis for claims of persecution that allow them to seek asylum, which could be their only plausible pathway to the U.S.
Additionally, the deregulation of agricultural laws in India and the subsequent large-scale farmers’ protests–which primarily impacted the northern states of Punjab and Haryana–have fueled a sense of economic instability. This comes at a time when both states are grappling with high unemployment rates and a severe drug crisis among their youth, creating even greater incentives for migration.
The arrival of irregular migrants from distant countries like India poses unique political and logistical challenges for U.S. authorities. Gathering comprehensive data on these migrants is often difficult due to the multiple countries they pass through on their journeys to the United States and the rapidly changing nature of their travel routes. This complexity can obscure critical information about their identities and the reasons they are leaving their home countries.
This guide compiles various sources to help shed light on this type of migration, offering a clearer understanding of the factors driving it and the challenges it presents.
Growth and areas of entry over time
Southern border
Reports have indicated that many irregular Indian migrants have entered the Americas through El Salvador or Nicaragua. Until November 2023, Indian nationals had visa-free travel status to El Salvador, and Nicaragua has actively facilitated irregular migration from outside of the hemisphere. Both countries are situated north of the Darién Gap in Panama—a region known for its physically demanding and dangerous terrain—which makes them strategic entry points for migrants seeking to avoid this hazardous crossing.
However, the preferred routes are starting to change. While Indian encounters at the U.S. southern border have shown a consistent decline after El Salvador rescinded its visa-free policy and added a $1,130 fee on Indian travelers in the fall of 2023, there has been a modest increase in encounters with Indian migrants in Panama. This increase indicates that at least some of these migrants are opting to continue their journeys to the U.S. from South America, where they can access visas on arrival in Bolivia.
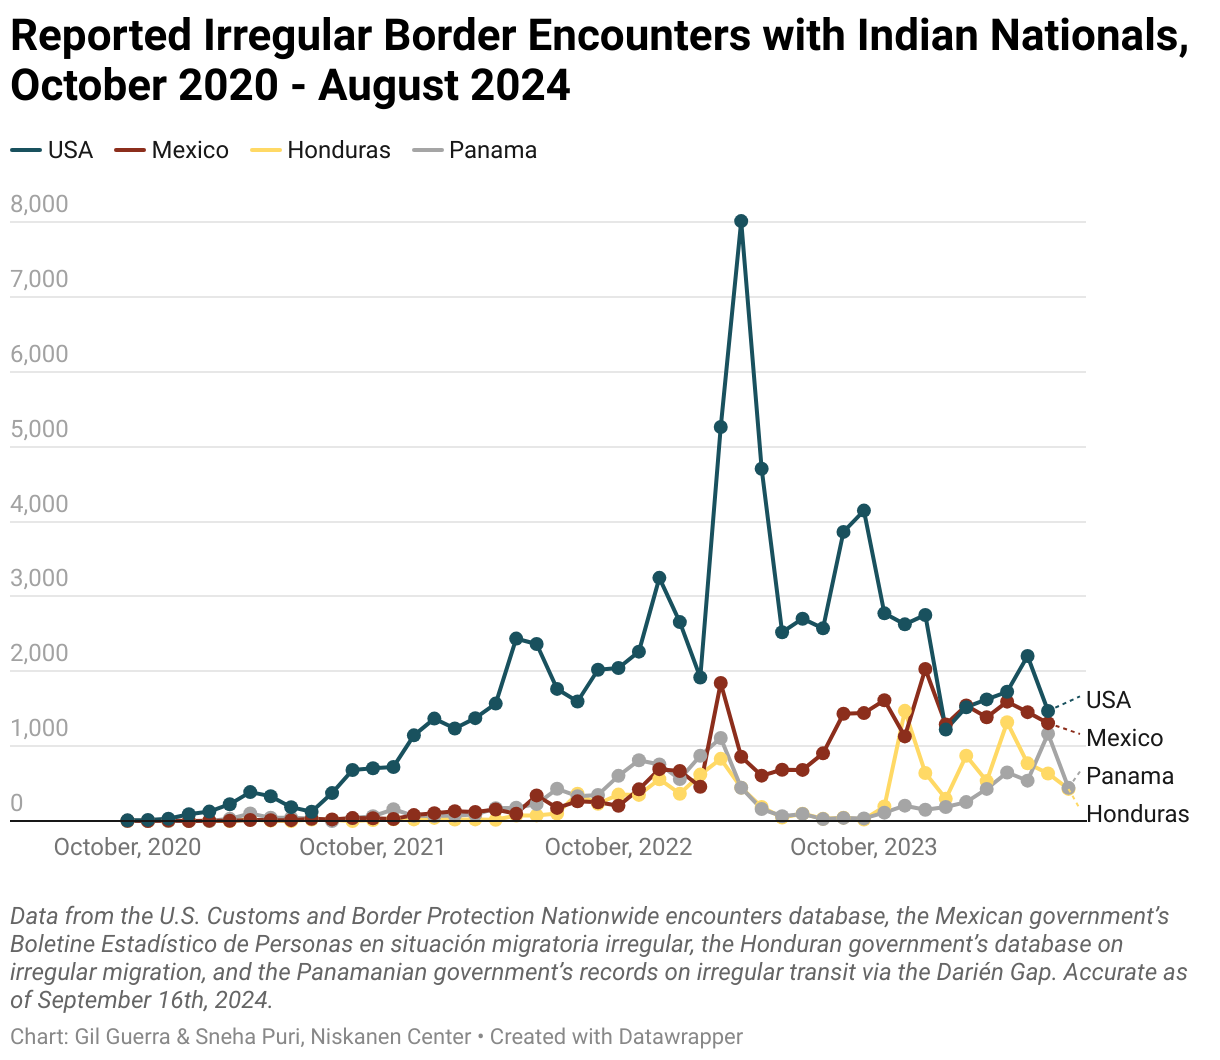
However, the most notable shift in encounters has occurred at the U.S.-Canada border.
Northern border
The following chart illustrates encounters with Indian nationals using the U.S. Customs and Border Protection Nationwide Encounters database. From January 2024, the sharp increase in encounters at the northern border significantly surpasses encounters in the more conventional Southwest Border region.
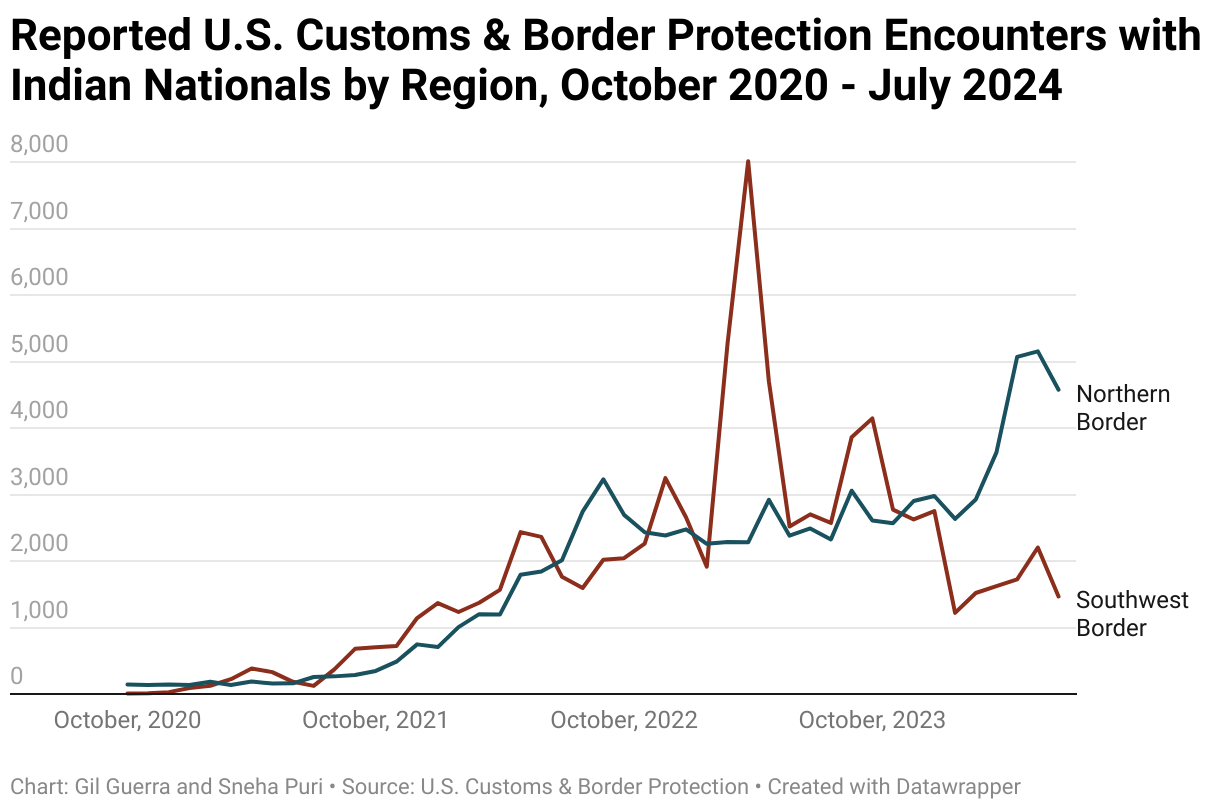
Canada is increasingly a more accessible entry point for Indians. The average processing time for a Canadian visitor visa is 76 days (whereas the wait time for a U.S. visitor visa appointment in India is almost one-year ). The U.S.-Canada border is also longer and less guarded than the U.S.-Mexico border. And while it is not necessarily safer, criminal groups do not have the same presence there as they do along the route from South and Central America.
U.S. Customs and Border Protection categorizes northern border encounter data in 13 “sectors” with multiple stations over a large region that often spans one or more states. While it is likely that most individuals encountered in any of these sectors came from the northern border (Canada) it is not certain. Nevertheless, a comparative analysis of the sectors in the northern and southern border regions reveals more details about this geographic shift.
Sector
Encounters in the northern and southwest border regions each account for a third of all encounters with Indian nationals since October 2020, with the remaining one-third occurring in other posts nationwide.
The following chart shows the data of the seven sectors or field offices with the highest number of encounters since October 2022.
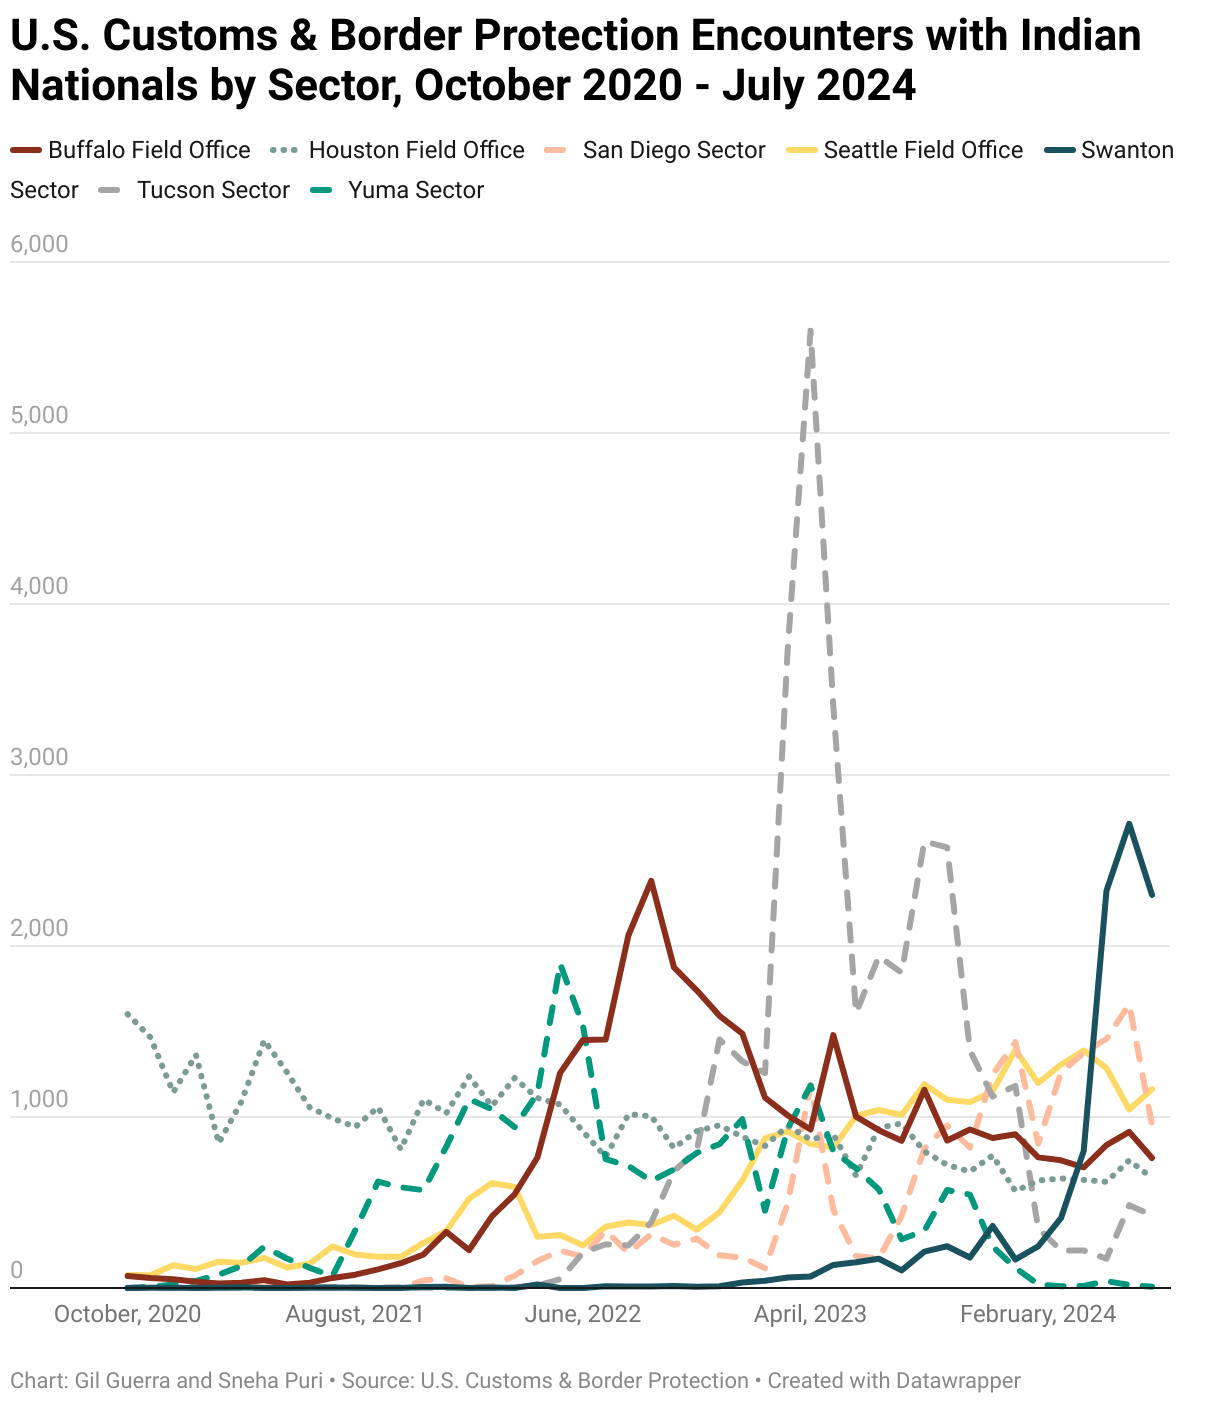
The Swanton sector—which covers the entire state of Vermont and several counties in New York and New Hampshire—has experienced a sudden surge in encounters with Indian nationals since early 2024, peaking at 2,715 in June 2024. This corresponds to the spike in encounters with Indian nationals near the northern border, where the Swanton sector lies.
From February to November 2023, the Tucson Sector in Arizona registered the highest number of encounters with Indian Nationals, reaching a peak of 5,598 in April 2023. This was also the month with the highest number of Indian nationals encountered in the Southwest border region since October 2020; the Tucson sector accounted for almost 70% of all encounters in the region that month.
Age and gender
Age and gender data
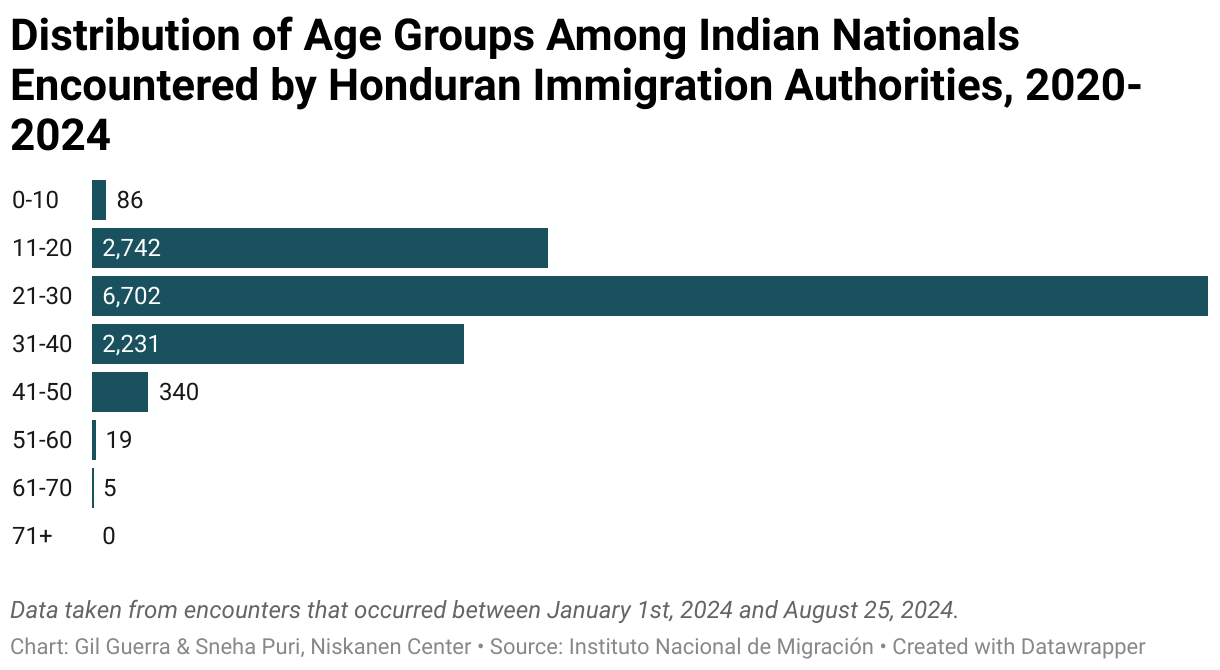
Of the countries irregular Indian migrants pass through on their way to the U.S., only Honduras captures detailed data about age and gender. This data may not be representative given the small sample size recorded by Honduran authorities and potential differences in the type of migrant who passes through Honduras compared to other routes.
Over 95% of irregular Indian migrants encountered in Honduras were men. Of these, 76% were adults and 24% were minors. While female migrants were comparatively underrepresented in this group, among them, 80% were adult women, and 20% were minors.
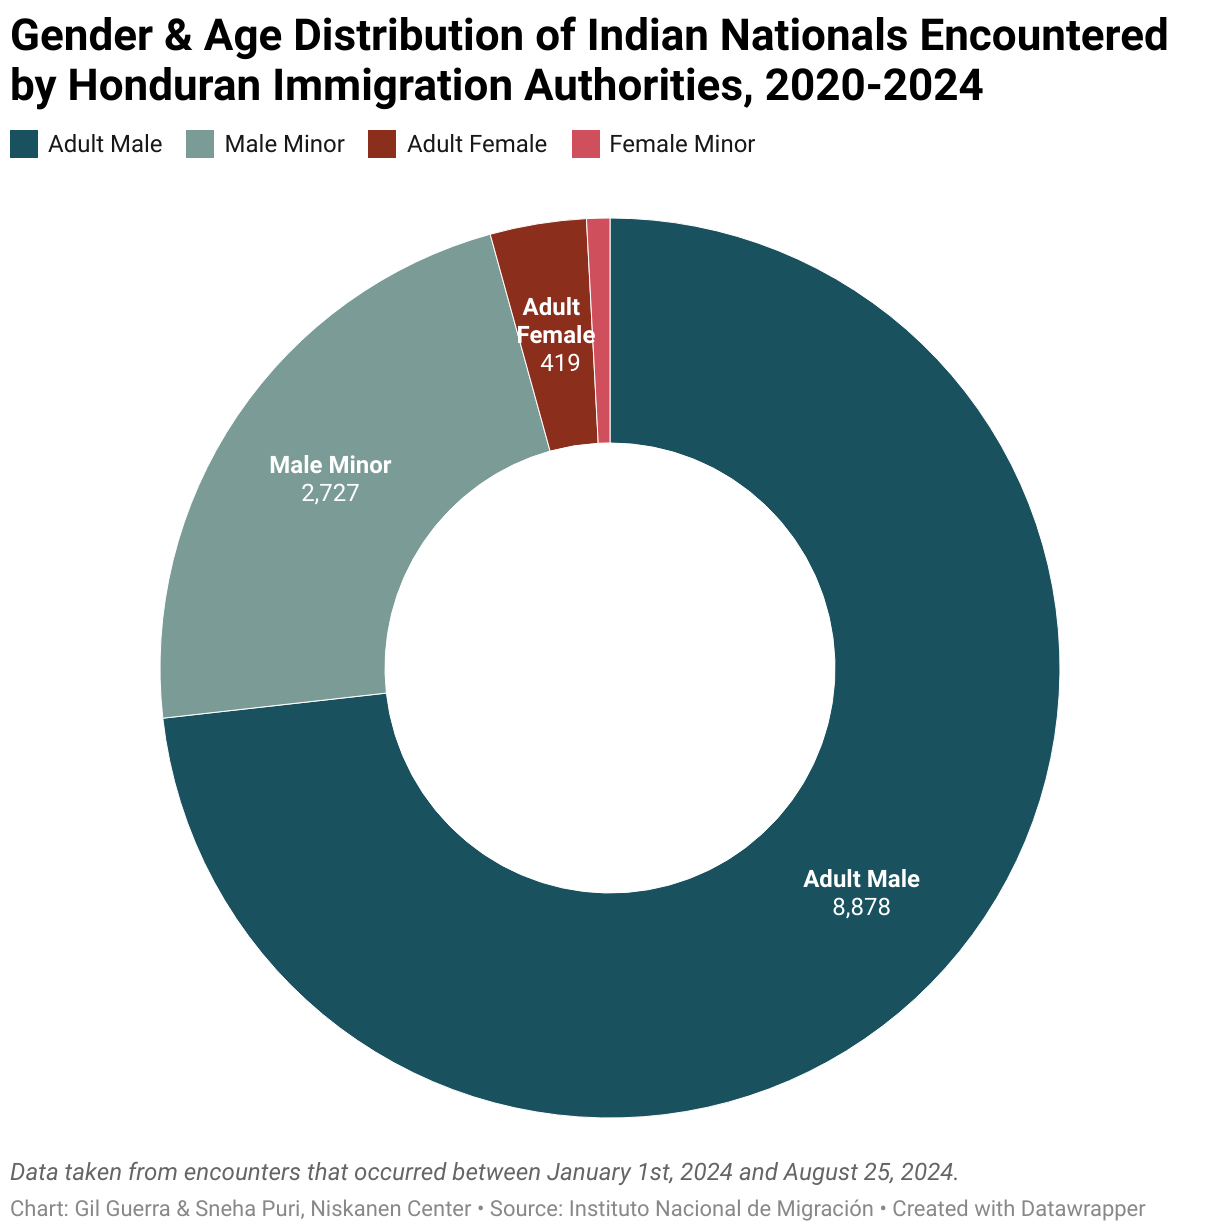
Data from the U.S. paints a comparable picture. Among Indian nationals with new proceedings in U.S. immigration court in 2024, 80% were male. In the Honduran data, the migrants also represented a young demographic. A total of 55% were between the ages of 21 and 30, and there were over seven times as many migrants under the age of 20 as there were over 40. This is also roughly on par with U.S. court data, where 72% of Indian nationals with new proceedings in 2024 were between 18 and 34.
Family demographics
Since October 2020, single adults have made up 81% of all encounters with Indian nationals in the southwest and northern borders. This figure has been gradually increasing each fiscal year, from 70% in FY 2021 to over 82% in FY 2024 (YTD).
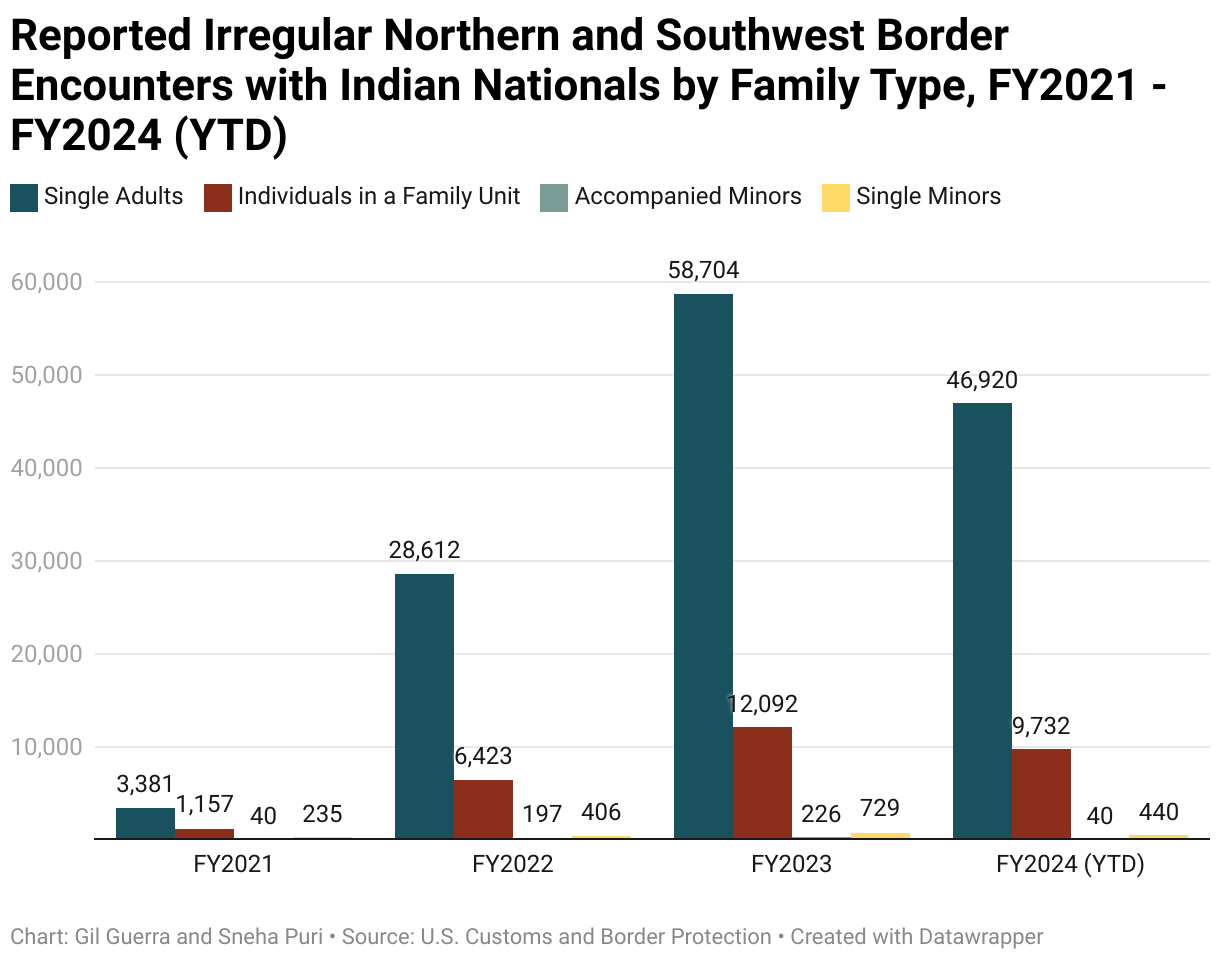
There were notable differences in the family demographics of Indian nationals encountered at the northern and southwest borders in FY 2021 and FY 2022. In FY 2021, 52% of Indian nationals encountered at the southwest border were single adults, while just under 40% were in a family unit. Meanwhile, 92% of encounters at the northern border involved single adults, and only 6% involved individuals in a family unit. This pattern persisted into FY 2022.
However, this gap narrowed in FY 2023 and FY 2024 (YTD), with just over 80% of encounters at both borders involving single adults and 16-18% involving individuals in a family unit.
Language, locations, and outcomes
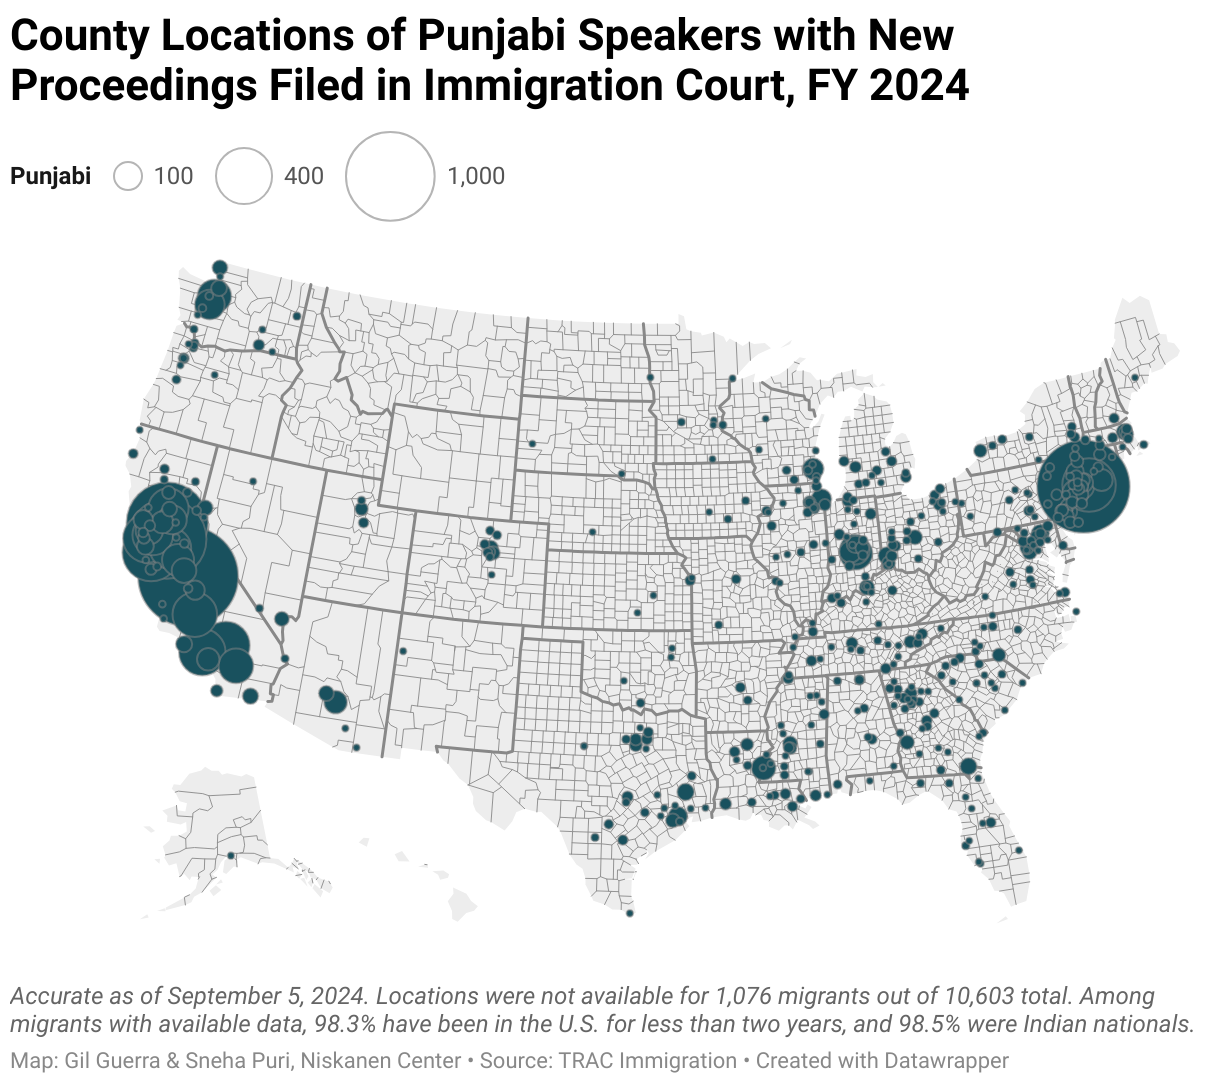
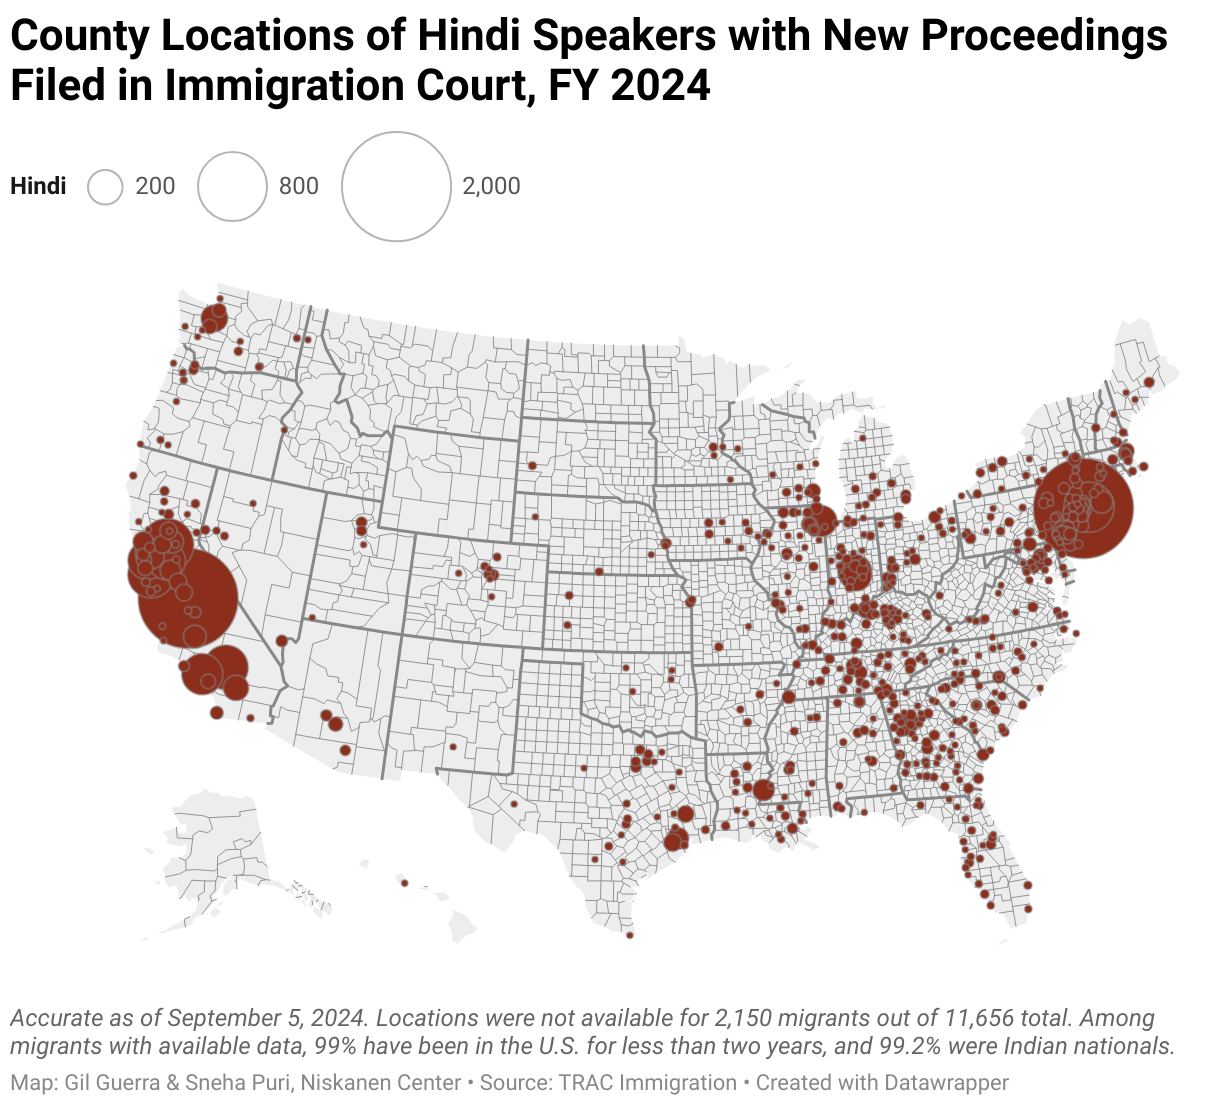
Since 2012, the top three languages spoken by Indian migrants (aside from English) with new proceedings in immigration court are Punjabi (79,656), Hindi (39,616), and Gujarati (18,639). This is in line with reports that many migrants are from the northern states of Punjab and Haryana. While religious demographic data is not readily available, many Punjabi speakers are likely Sikhs.
By utilizing the zip codes recorded in this court data, we can track where recent Indian migrants have settled in the U.S. Their settlement patterns largely reflect the Migration Policy Institute’s estimate of where the broader Indian diaspora lives in the U.S., but with a few notable exceptions. For instance, although a significant number of Indian immigrants live in Texas, few of the migrants in this dataset appear to be settling there. Additionally, while the MPI estimates that more Indian immigrants live in New Jersey than in New York, the opposite is true of migrants in the TRAC data.
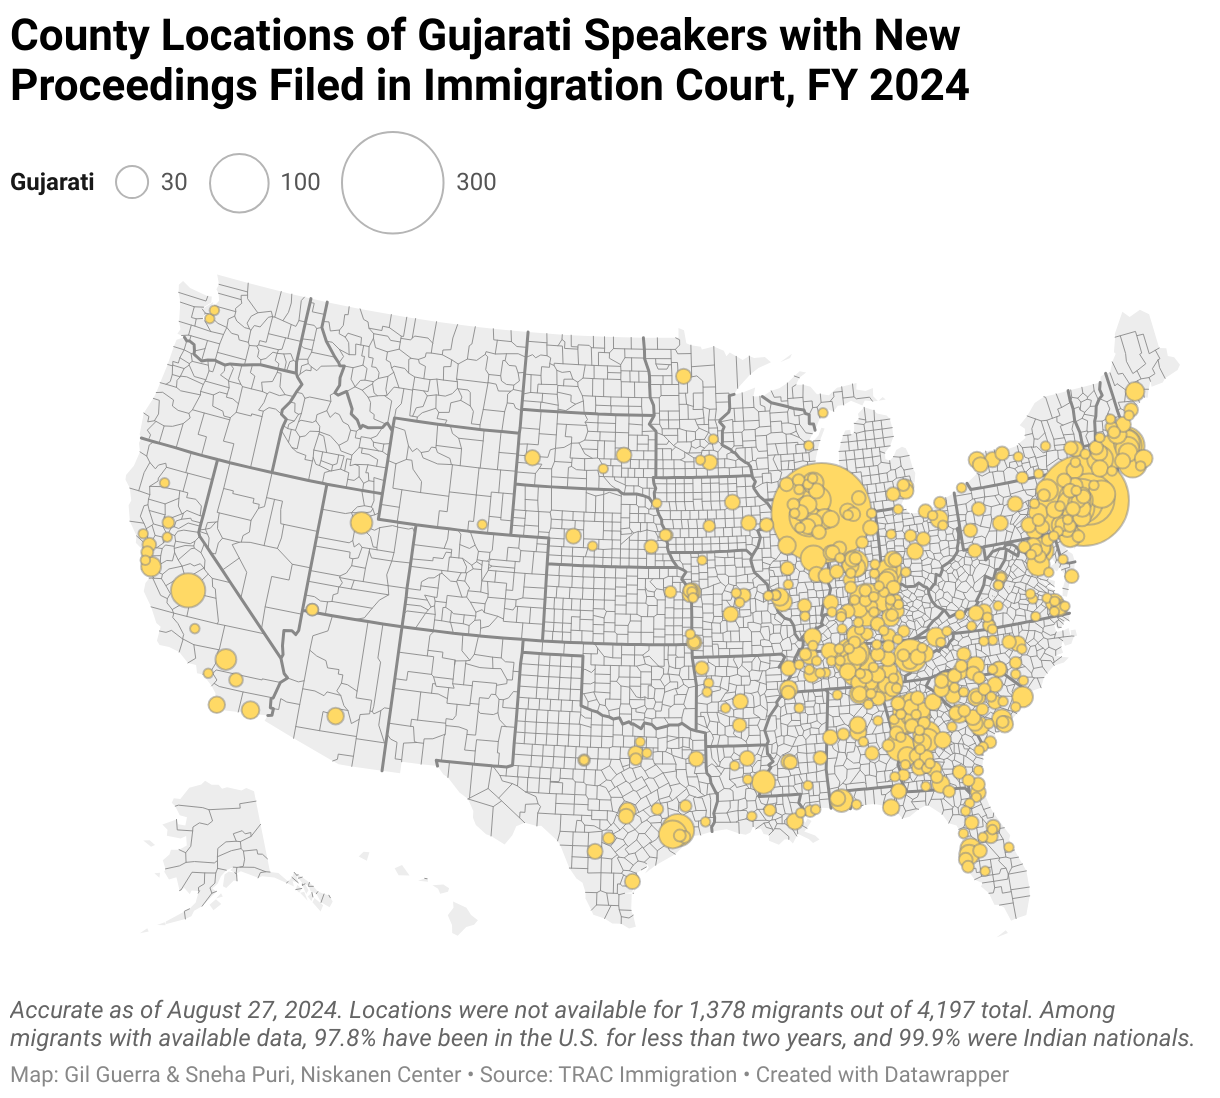
Additionally, there are notable differences in where speakers of different languages settle in the United States. Both Punjabi and Hindi speakers exhibit a bi-coastal pattern, with large populations in New York and California. However, slightly more Hindi speakers reside in New York, while more Punjabi speakers are found in California.In contrast, Gujarati speakers differ from both groups; they are more concentrated in the Chicago metropolitan area and throughout the southeast and upper south, with significantly less representation on the West Coast.
Language appears to be an important factor in the outcomes of asylum court decisions. In 2024, while the average grant rate for asylum or other relief among all nationalities was 48%, all three language groups—Punjabi, Hindi, and Gujarati speakers—had higher success rates. Punjabi speakers had a significantly higher success rate at 73%, while Gujarati speakers were closer to the average at 53%. This discrepancy is not explained by other factors such as whether applications were affirmative or defensive or differences in rates of legal representation. Legal representation rates were high across all groups: 98.7% of Punjabi speakers had representation, as did 97% of Hindi speakers and 95.8% of Gujarati speakers, compared to the overall average of 82% for all nationalities.
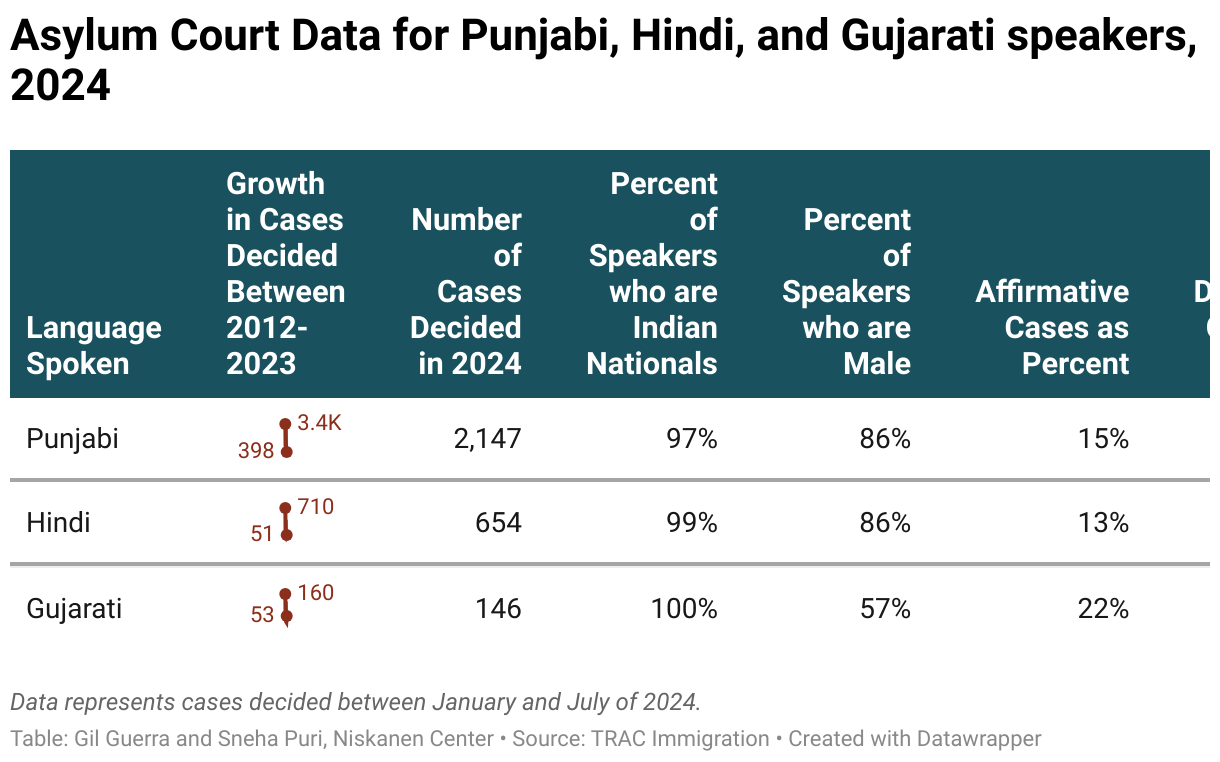
The higher rates of asylum for Punjabi speakers could be due to their larger overall numbers, while the smaller sample size of Gujarati speakers makes their results sensitive to outliers. Alternatively, this discrepancy might indicate that immigration courts find claims of religious and political persecution from Punjabi speakers more credible.
Conclusion
Irregular Indian migration has not yet become a significant concern for either the U.S. or Indian governments. For the U.S., this is likely due to the relatively low overall numbers of irregular Indian migrants and regional cooperation in deterrent measures aimed at these migrants. In addition to El Salvador’s revocation of visa-free status and the additional transit fee, Panama has recently deported hundreds of Indian migrants headed for the U.S., and Brazil has introduced new restrictions on the entries of Indian travelers who are likely to be migrants.
For India, this migration has seemingly not attracted significant concern among policymakers, despite the potential implications for the Sikh diaspora in North America. The Indian government remains sensitive to activities that support the Khalistan movement, which tend to be more pronounced among the diaspora. In the past year, tensions have escalated due to allegations of Indian involvement in actions against movement leaders in the U.S. and Canada.
Given that many recent irregular migrants from India are originating from the Punjab, a predominantly Sikh state, and are increasingly crossing through Canada while being granted asylum at high rates in the U.S., this issue has the potential to become a point of trilateral contention in the future. For now, however, there appears to be a tacit understanding among Indian policymakers that most of these migrants are driven by economicmotives and are unlikely to become seriously involved in separatist politics once they settle in the U.S.