In a poster presentation for the 2014 meeting of the American Geophysical Union, The Cato Institute’s Patrick Michaels and Chip Knappenberger argue that the climate models reported in the most recent assessment report from the Intergovernmental Panel on Climate Change (IPCC) produce more warming as a response to greenhouse gas emissions than is warranted. They conclude that policymakers should avoid basing any decisions on those climate models, or on reports and impact assessments that use them to examine future climate change.
Given that the arguments forwarded by Dr. Michaels and Mr. Knappenberger are frequently advanced by climate skeptics, they deserve a good look.
We will be examining their arguments in a series of three blog posts. Today, I will discuss the most important “big-picture” problems associated with their analysis.
Dr. Michaels and Mr. Knappenberger offer two lines of criticism. The first is a broad argument about the climate’s sensitivity to carbon dioxide. The second is a quantitative test of the fidelity of climate models to observations of the real world.
Both lines of criticism are incomplete, and overlook important details. Accordingly, their arguments simply do not stand up to scrutiny.
Climate Sensitivity
Dr. Michaels and Mr. Knappenberger claim that a growing body of literature indicates that climate models predict too much warming for a given increase in atmospheric carbon dioxide. That warming is typically quantified by equilibrium climate sensitivity (ECS), which represents the temperature increase that would result from doubling atmospheric carbon dioxide concentrations.
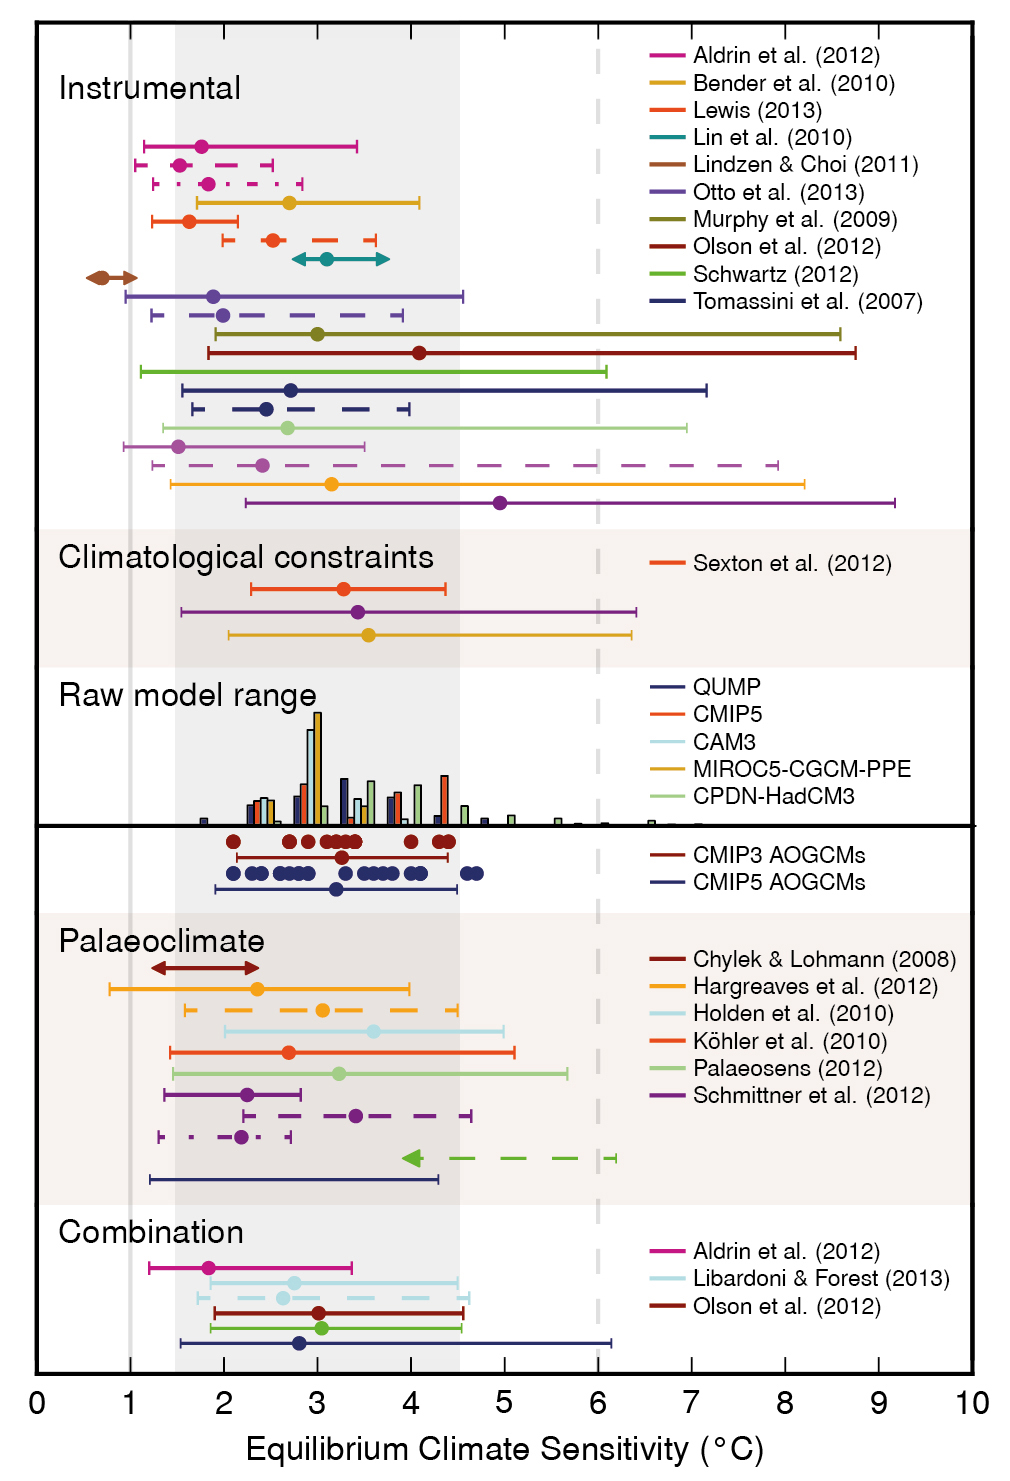
The most recent IPCC assessment finds that the ECS is likely (2/3 chance) between 1.5 and 4.5℃. Climate models show an average sensitivity of 3.2℃ with a range between 2 and 4.5℃. Dr. Michaels and Mr. Knappenberger, however, cite 20 studies published since 2011 whose central estimates of climate sensitivity are lower than the values found in climate models. Dr. Michaels and Mr. Knappenberger argue that, based on those studies, a better estimate of average sensitivity would be 2℃, not 3.2℃.
However, they omit significant portions of the scientific literature regarding climate sensitivity. A plurality of the studies they cite estimate ECS using temperature data from the instrumental period (the 19th century and forward) combined with simple climate models and estimates of how carbon dioxide and other factors are warming and cooling the planet. But that’s only part of the picture. Dr. Michaels and Mr. Knappenberger disregard other studies from the instrumental period and almost completely ignore ECS estimates derived from data gathered from the pre-instrumental period, and both need to be considered.
It’s understood that estimates of climate sensitivity derived solely from the instrumental period produce lower-end climate sensitivity. There are exceptions that show higher-end estimates, but recent studies do indicate an ECS at the lower end of the IPCC range. However, the instrumental period is short. The physical feedbacks that can amplify or dampen warming (like ocean heat uptake or changes to the earth surface) may take time to develop. Accordingly, such processes may still mature and lead to warming not yet observed in the instrumental record, increasing climate sensitivity.
Other techniques that estimate climate sensitivity, like climate models and paleoclimate (studies of climate change deep in earth history), allow such effects to mature. Such investigations generally produce higher levels of climate sensitivity than the studies forwarded by Dr. Michaels and Mr. Knappenberger.
Paleoclimate records in particular give us a sense of what greenhouse gas emissions may have in store for us when the climate system adjusts to feedbacks over the long term. For example, a recent study of the warm Pliocene era (5.3 to 2.6 million years ago, a period in which carbon dioxide concentrations reached 450 parts per million and global average temperatures were 2-3℃ warmer) suggests that climate sensitivity at that time was likely between 2 and 3℃. A recent metastudy of paleoclimate sensitivity estimated that evidence from the last 65 million years indicates ECS consistent with a range of 2.2 to 4.4 ℃.
This table from the last IPCC assessment summarizes ECS estimates from various lines of evidence. Some of the studies cited by Dr. Michaels and Mr. Knappenberger are included. But critically, the table also includes studies from analysis of instrumental and non-instrumental datasets (such as those mentioned above) that Dr. Michaels and Mr. Knappenberger (without any explanation) manage to ignore.
At present, no single line of evidence appears more valid or trustworthy than another. The quality of data for each type of study varies, and each methodology makes assumptions about the nature of climate sensitivity that scientists are still working to understand. That is why the body of evidence maintains a high degree of uncertainty regarding climate sensitivity, as indicated the last IPCC report.
Dr. Michaels and Mr. Knappenberger focus on a specific set of studies that tend toward lower climate sensitivity, claiming that recent scientific literature is therefore converging toward lower values of climate sensitivity. But the conclusion that those studies offer a better or more accurate estimate of climate sensitivity seems to be based on their vintage and abundance. Dr. Michaels and Mr. Knappenberger offer no argument for why those studies provide a better or more accurate estimate of climate sensitivity than estimates that come from other lines of evidence.
Testing Climate Models
Dr. Michaels and Mr. Knappenberger reject the climate models reported in the latest IPCC assessment because, they contend, those models produce warming estimates that do not match the temperatures observed over the last half century. The test they employ, however, is sensitive to end-date and may not actually indicate shortcomings in how climate models will predict future warming. They also exaggerate the degree to which the climate models “ran hot” in the 2000s. Recent developments in the literature produced insights about why the simulations used by the IPCC warmed faster than the globe over the past two decades, and that literature also challenges their test.
To illustrate the problems associated with the Michaels and Knappenberger test, I have repeated their test below. In the first panel:
a) The vertical axis shows the global temperature warming trend calculated from 1951 through 2014, then again from 1952, 1953, and on through 2004, always ending in 2014. Thus, early values show trends calculated over 50-60 years, while the latest value shows the trend from 2004-2014.
b) The black squares show the warming trend from the global temperature record (hadCRUT4, a compilation of weather data to global temperature produced by the UK Met Office).
c) The black lines show trends calculated for 108 climate model simulations; the solid line represents the mean trend, and dashed lines represent the 95% confidence interval produced by models.
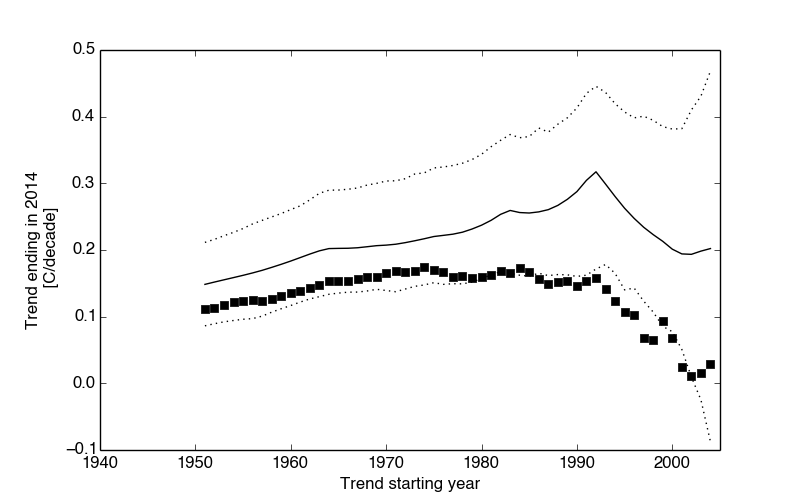
Because the hadCRUT4 trends (black squares) sit below the confidence intervals for trends starting in the late 70s through the mid-2000’s, Mr. Michaels and Mr. Knappenberger dismiss this set of climate models as failed mathematical hypotheses that are too sensitive to carbon dioxide.
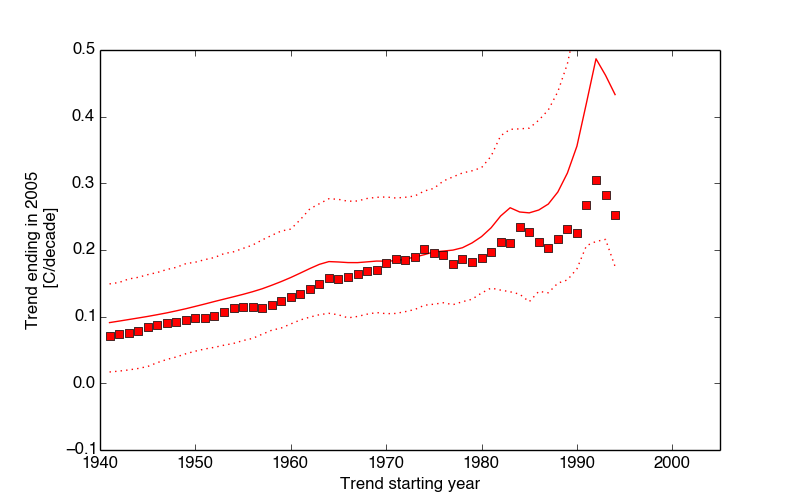
This trend analysis, however, strongly depends on the choice of end year. In this second panel, I repeat the test with a different time series: one that begins and ends eight years earlier (1943-2006 vs. 1951-2014). The results show general consistency between the models and the global temperature record.
Examining the global temperature record itself helps to explain the difference between these two findings. As illustrated below, the performance of the climate models over the late 20th century seems reliable. Over the 2000’s, however, the warming predicted by climate models has been faster than that observed over the globe.
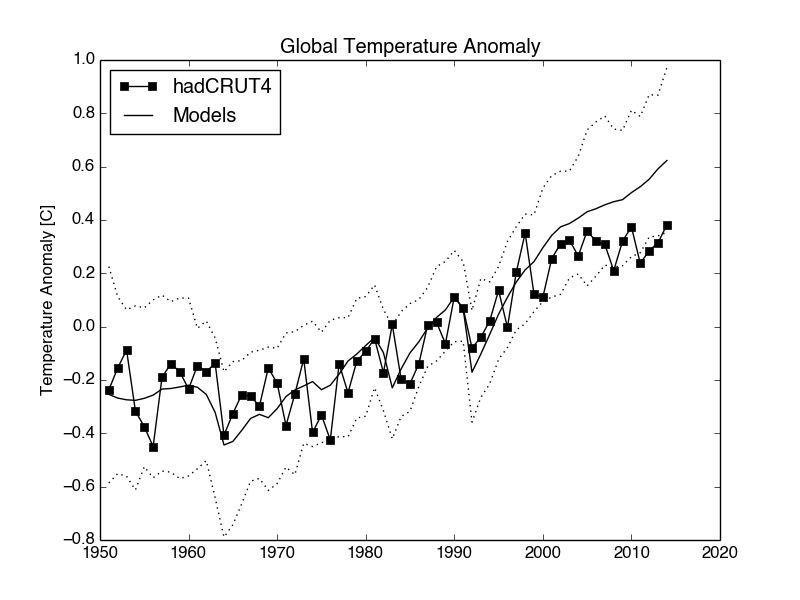
Even so, the Michaels and Knappenberger test appears to exaggerate the difference between the warming predicted by the models and temperature observations made over the last decade. Comparing the warming rate, instead of temperature, propagates the difference in the recent decade back to the late 70s.
But Dr. Michaels and Mr. Knappenberger’s test flirts with important questions. Does the mismatch in warming simulated by models and observed in global temperature datasets invalidate global climate models? Does it prove them too sensitive to carbon dioxide forcing?
These climate model simulations are designed to represent best estimates of historical conditions (greenhouse gas concentrations, solar activity, volcanic activity, human aerosol pollution, and other human and natural factors that affect the heat budget of the atmosphere –called forcings) through the year 2005. For 2006 through 2014, the simulations extrapolated those best-estimates forward. But the best-estimates of the impact of solar and aerosol effects on global temperatures turned out to be less than scientists had predicted—the errors even stretching back into the 1990’s. Those errors produce more warming in the models than might otherwise be the case.
Last year, a group of scientists recalculated how climate simulations would look after those forcing errors were corrected. One result from their study is shown below, with a partial—but notable—reconciliation of the models with the temperature observations of the 2000s. Compare the solid black line (updated model estimates) with the dashed and solid red (temperature records).
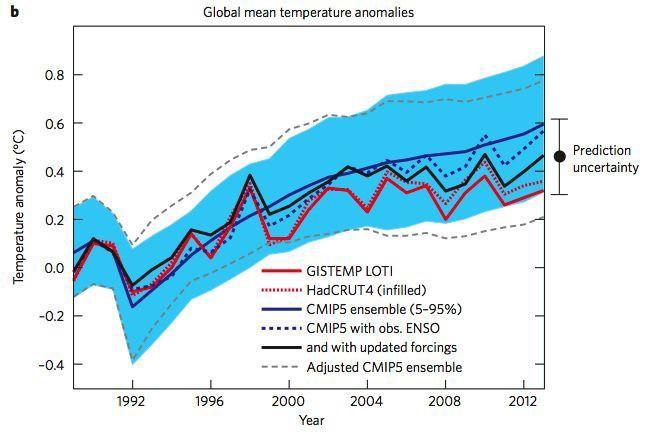
After correcting for the forcings incorporated in the climate models, the decade of the 2000s still shows some divergence between modeled simulations and the temperature record. Those differences are likely explained by the fact that the missing heat has been subsumed by the oceans. Oceans hold a lot of heat compared to the atmosphere. Oscillations in how it transfers that heat with the atmosphere could well explain the remaining difference between the modeling and the temperature record.
Internal variability, however, does not necessarily imply lower climate sensitivity. Another group of researchers looked at the same set of 108 climate model simulations, and found that 19 of the 108 simulations exhibited a slowdown in warming between 1995 and 2015– a slowdown similar to the one we have observed in the global temperature record. Even so, there was no significant difference in the warming predicted by those models for 2050 or 2100 relative to the models that missed the 1995-2015 slowdown. Therefore, models exhibiting a slowdown do not suggest that warming will comparatively slow by the end of this century.
While there has been a notable slowdown in temperature increases since the record high El Nino in 1997/1998, recent research suggests that claims of a global warming hiatus or pause are questionable after one takes account:
a) The aforementioned ocean heat uptake,
b) More sophisticated statistical analysis of the temperature record, and
c) How temperature data are compiled into a global average, which often times leaves much to be desired.
Clearly, scientists have more work to do to resolve the various uncertainties about why we observe as much climate change as we do and what that that may mean for future warming. But the analysis offered by Dr. Michaels and Mr. Knappenberger is too problematic to say much about those challenges.